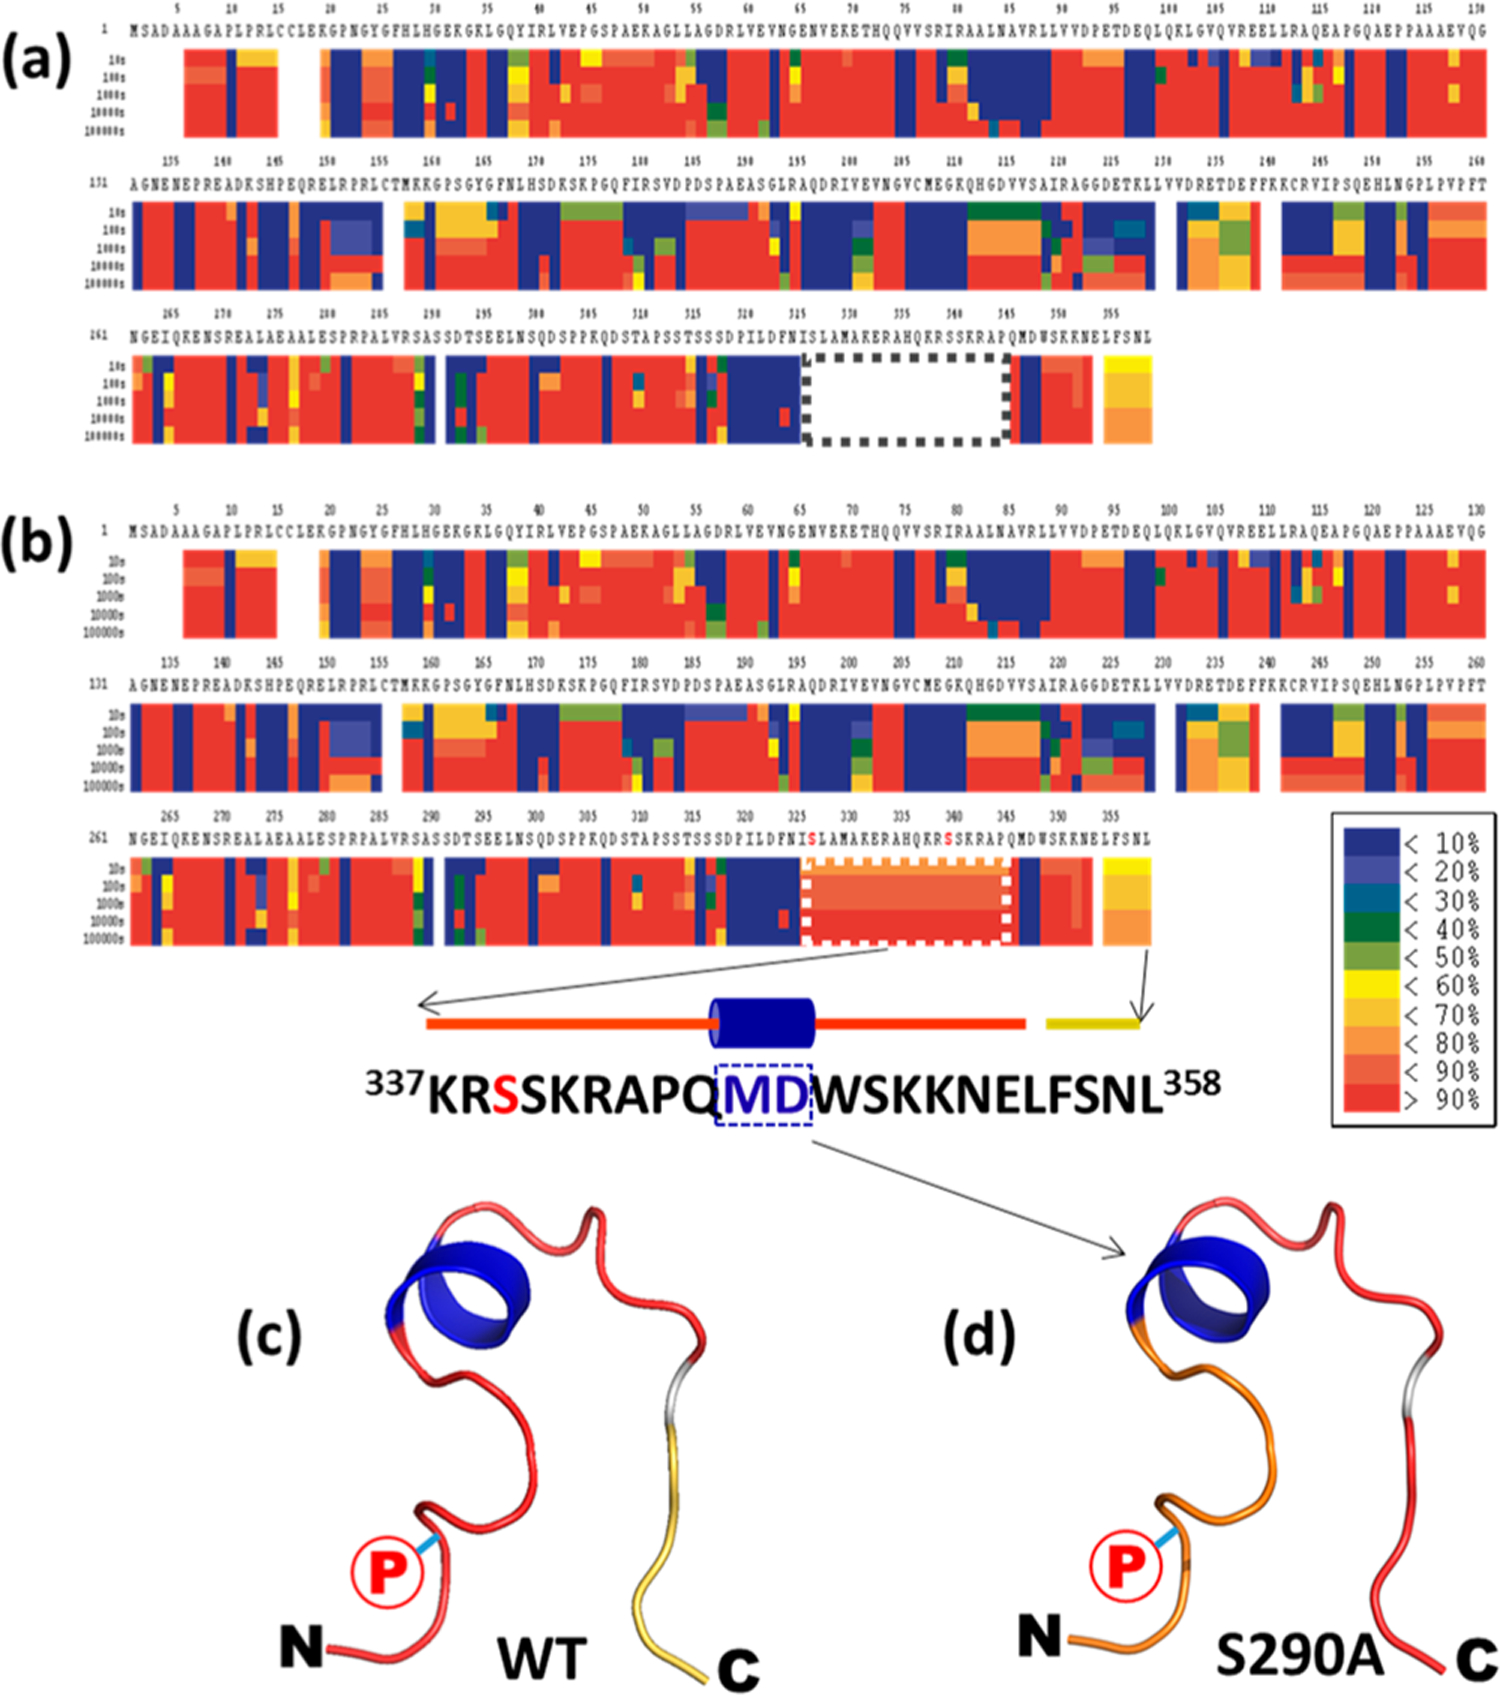
Figure 2.

Incorporation of PTMs in HDXMS data analysis improves protein coverage of NHERF1. (a) Without considering PTMs, the HDXMS heat map of NHERF1 showed no sequence coverage between residues 325 and 344 (boxed) in the C-tail. (b) After a phosphorylation-containing peptide was added to the peptide pool for HDXMS analysis, the sequence coverage for residues 325−344 (boxed) was obtained. (a) and (b) are used to demonstrate the improved protein sequence coverage. Enlarged heat maps are shown in Figure S2. (c, d) The HDX rates of the C-tail of WT and mutant S290A NHERF1 were mapped to the structural model of the C-tail of NHERF1. N- and C-termini of the C-tail are indicated. A phosphorylation site was labeled with a circled red P. Residues “MD” in the middle of the α-helix were more protected (blue) from HDX. In contrast, residues in the loop show variable D incorporation (red). The predicted structural model shown in (c) and (d) was built on the basis of the NHERF1 C-terminal 22 residues (sequences and cartoon representation were shown in (b)) using the program Leap (AMBER 9) as described previously.27,28 Shown are secondary structures in ribbon format.
