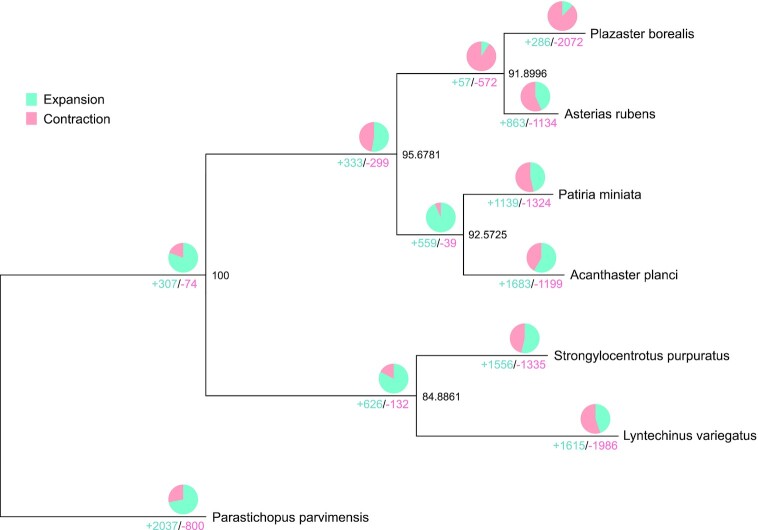
Figure 2:
A phylogenetic tree of P. borealis and 6 other species. This tree was constructed using protein sequences of 7 species, showing gene family expansion and contraction. The number below the branches represents the number of gene families with either expansion (blue) or contraction (red). The ratio of expanded and contracted gene families is expressed in the pie chart above the branches. The numbers at the node indicate the bootstrap value. The species used in the tree are P. borealis, A. rubens, A. planci, P. miniata, L. variegatus, P. parvimensis, and S. purpuratus.

