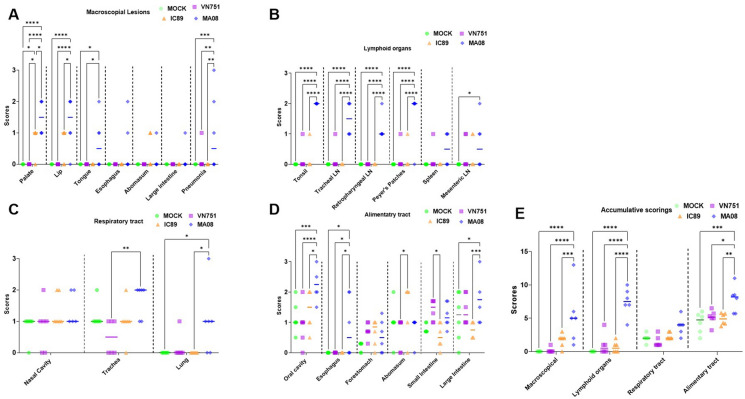
Figure 6.
Pathological evaluation of PPRV-induced lesions. A shows macroscopic lesions in digestive and respiratory tracts, while B, C and D depict histological scoring in lymphoid organs, respiratory and digestive tracts. E represents the accumulative macroscopic and histological scoring of suspected PPRV-induced post-mortem lesions. LN: lymph nodes. Single lines in each organ or group assessment represent the median. P-values were calculated using Tukey multiple comparison tests with individual variances computed for each comparison. Asterisks highlight the statistical differences observed between the infected or vaccinated groups and the mock-inoculated group. *P-values < 0.05; **P-values < 0.01; ***P-values < 0.001; ****P-values < 0.0001.

