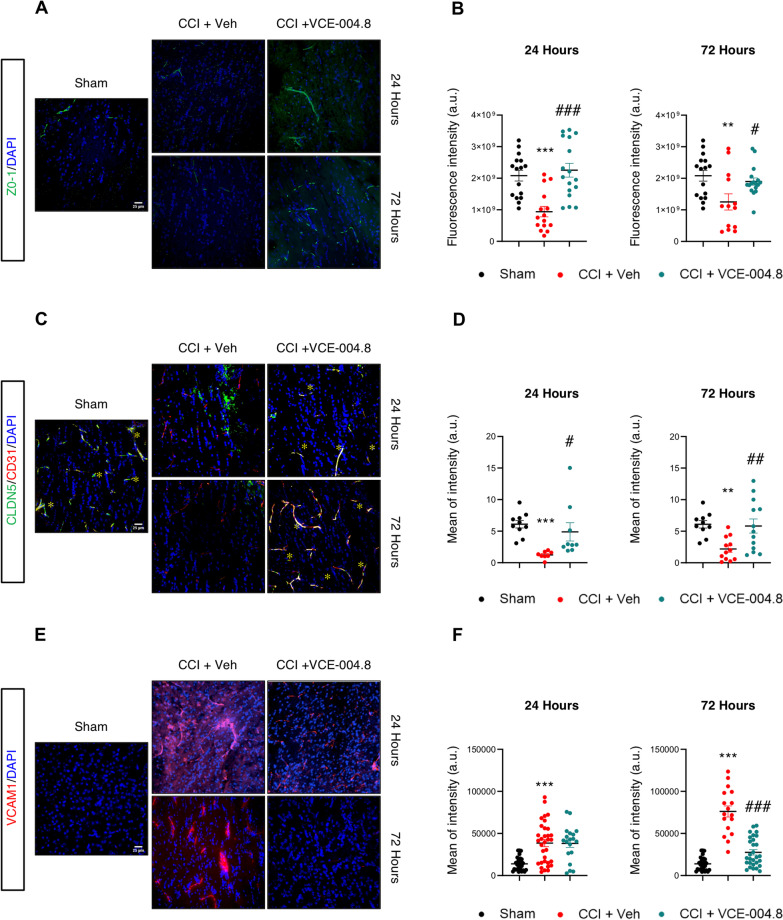
Fig. 7.
Effect of VCE-004.8 treatment on BBB integrity after TBI. A-C-E Representative immunofluorescence images and quantification B-D-F showing the expression of ZO-1, CLDN5 and VCAM1 in the ipsilateral corpus callosum at 24 h and 72 h after the brain injury. Data are represented as mean ± SEM, and significance was determined by one-way ANOVA followed by the Tukey’s post hoc test or Kruskal–Wallis post hoc test. B (24 h: p = 0.0003; ***p < 0.001, 72 h: p = 0.0073; **p < 0.01 CCI + Vehicle vs Sham; 24 h: p < 0.0001; ###p < 0.001, 72 h: p = 0.0408; #p < 0.05 CCI + VCE-004.8 vs CCI + Vehicle), D (24 h: p < 0.0001; ***p < 0.001, 72 h: p = 0.0086; **p < 0.01 CCI + Vehicle vs Sham; 24 h: p = 0.0180; #p < 0.05, 72 h: p = 0.0090; ##p < 0.01 CCI + VCE-004.8 vs CCI + Vehicle), F (24 h and 72 h: p < 0.0001; ***p < 0.001 CCI + Vehicle vs Sham; 72 h: p < 0.0001; ###p < 0.001 CCI + VCE-004.8 vs CCI + Vehicle). Scale bars equivalent to 25 µm

