Fig. 2.
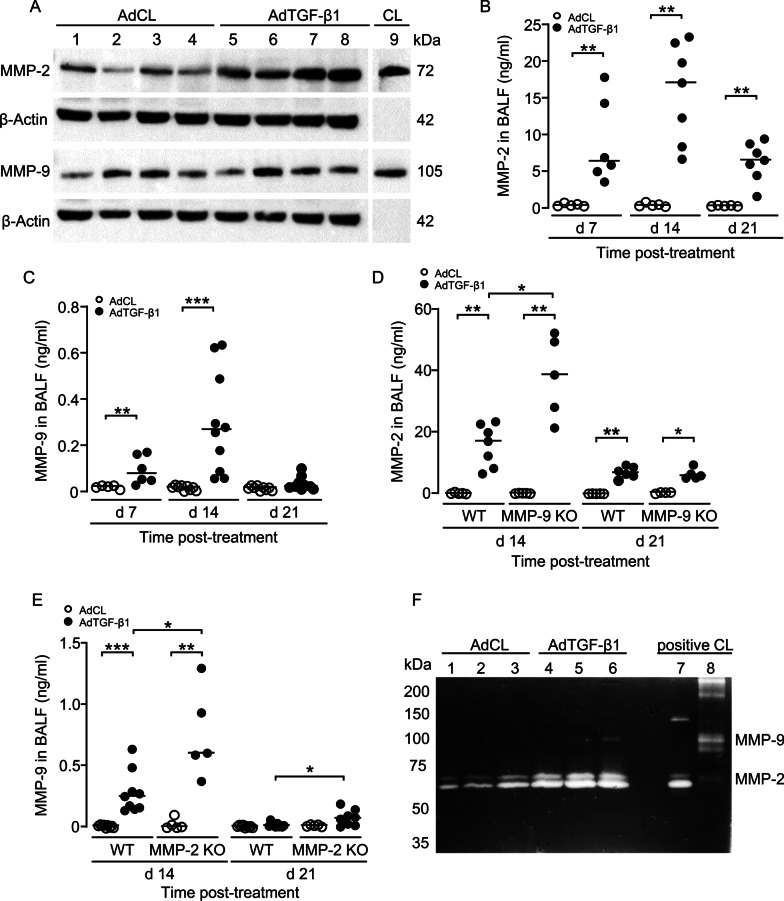
Analysis of MMP-2 and MMP-9 protein levels in experimental lung fibrosis in mice. A Western blot analysis of MMP-2 (72 kDa) and MMP-9 (105 kDa) proteins in lungs of AdCL versus AdTGF-β1-treated mice, as indicated. Beta-Actin (42 kDa) was used as a loading control. B, C MMP-2 (B) and MMP-9 (C) protein levels were measured in BALF of mice treated with AdCL (white dots) or AdTGF-β1 (black dots) at 7, 14 and 21 days post-treatment, as indicated. D MMP-2 protein levels in AdCL (white dots) or AdTGF-β1 (black dots) exposed WT and MMP-9 KO mice at days 14 and 21 post-treatment, as indicated. E MMP-9 protein levels in AdCL (white dots) or AdTGF-β1 (black dots) exposed WT and MMP-2 KO mice at days 14 and 21 post-treatment, as indicated. F Gelatin zymography of latent MMP-2 (72 kDa), or active MMP-2 (64 kDa), and latent MMP-9 (105 kDa) in BAL fluids of AdCL versus AdTGF-β1 treated mice at 21 days post-treatment, as indicated. Data in (B-E) are shown as scatter plots with median values indicated as horizontal lines of n = 5–10 mice per time point and treatment group. *p < 0.05, **p < 0.01, ***p < 0.001 (Mann–Whitney U test)

