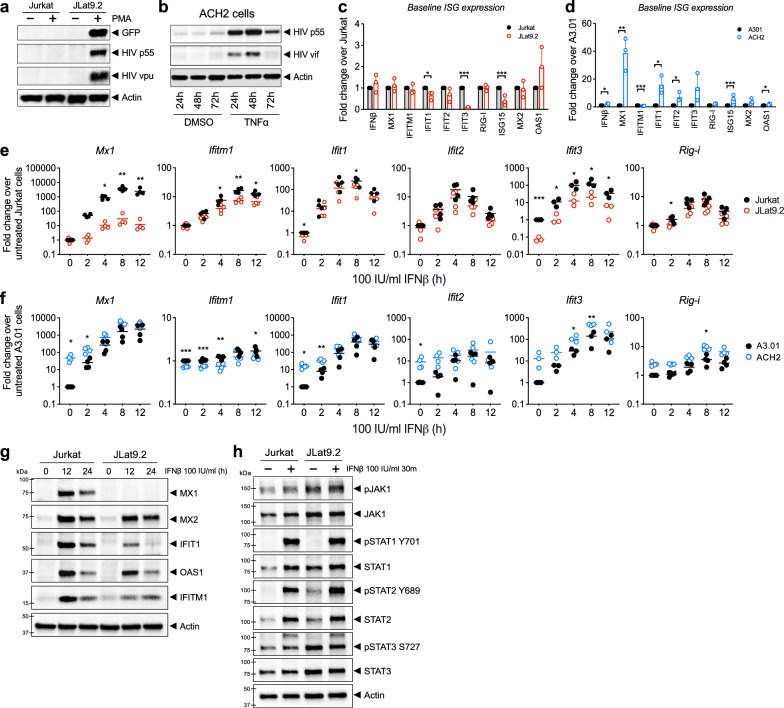
Fig. 1.
Analysis of latent cell line response to IFNβ stimulation a,b Immunoblot analysis of HIV proteins in uninfected Jurkat vs latent JLat9.2 cells treated with 16 nM PMA for 24 h (a), or in latent ACH2 cells mock-treated (DMSO) or reactivated with 10 ng/ml TNFα for indicated times (b). c,d qRT-PCR analysis of resting ISG mRNA expression in Jurkat vs JLat9.2 cells (c) or A3.01 vs ACH2 cells. ISG expression data for untreated cells (0 h IFN) is also shown in graphs c & c. (d). e,f qRT-PCR analysis of IFN-induced ISG mRNA expression in Jurkat vs JLat9.2 cells (e) or A3.01 vs ACH2 cells (f) treated with 100 IU/ml IFNβ for indicated times. In c-f, fold change (FC) was calculated relative to untreated, uninfected cells (ΔΔCt method), and each symbol represents mean FC of replicates from a single experiment. Data from three independent experiments are shown. Statistical significance relative to similarly treated control cells (Jurkat or A3.01) was calculated by unpaired Student’s t-test; asterisks denote significance (*p < 0.05, **p < 0.01, ***p < 0.001). g,h Immunoblot analysis of Jurkat or JLat9.2 cells stimulated with 100 IU/ml IFNβ for indicated times. Representative images from one of three independent experiments are shown. See quantification data in Additional file 1: Figure S1i, j

