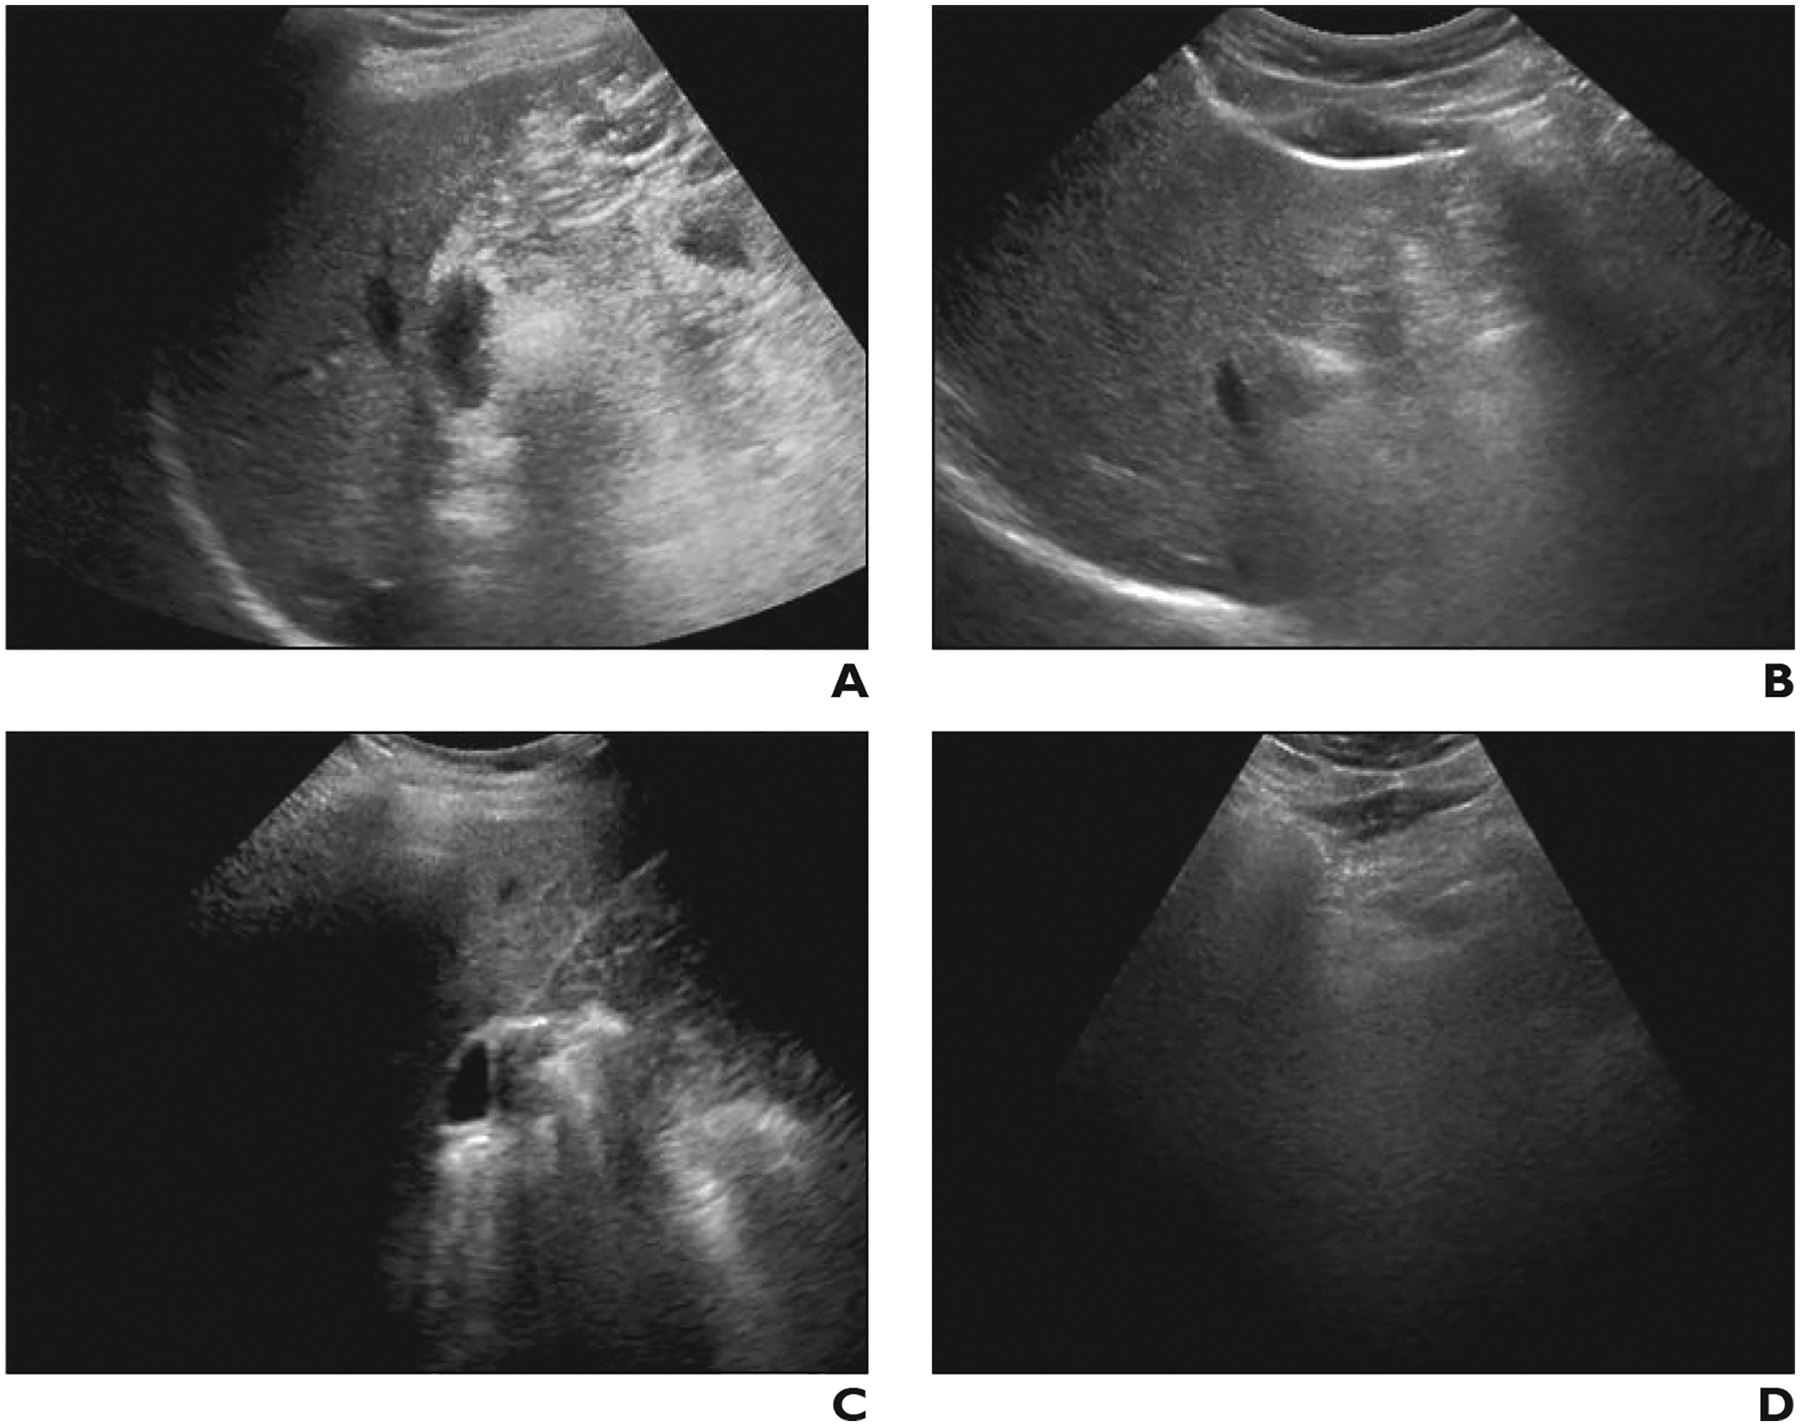
Fig. 3—

Difference in visualization score between sonographers with different examination volumes in 47-year-old man with chronic hepatitis B. Both examinations were performed in outpatient setting using same scanner model and were interpreted by abdominal radiologists.
A and B, Gray-scale ultrasound images of right (A) and left (B) lobes of liver, obtained from high-volume sonographer (> 500 examinations performed during study period), show near-complete visualization of hepatic parenchyma. Visualization score A was assigned.
C and D, Gray-scale images of right (C) and left (D) lobes 6 months later obtained by low-volume sonographer (< 50 examinations) show that nearly entire right lobe is obscured by rib (C) and left lobe obscured by bowel (D). Visualization score C was assigned.
