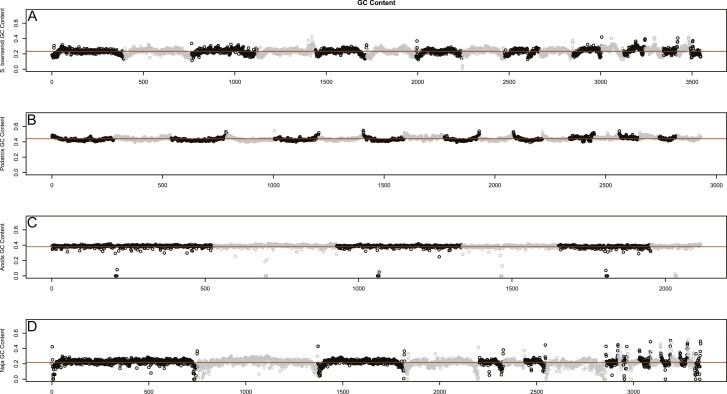
Figure 6.
Genome-wide patterns of GC content across representative squamate taxa, orange line representing the genomic mean. Broadly, pattern of GC content appears most similar, both in chromosome patterns and mean per-window GC content (~0.2), between (A) Sphaerodactylus and (D) Naja. Both (B) Podarcis and (C) Anolis have a considerably higher mean per-window GC (~0.4), and Podarcis shows an inverse pattern to Sphaerodactylus and Naja in that GC goes up at the tips of chromosomes instead of down. We believe that the Anolis patterns here are less informative in this regard as the sequencing method employed is not directly comparable to the other 3 genomes.

