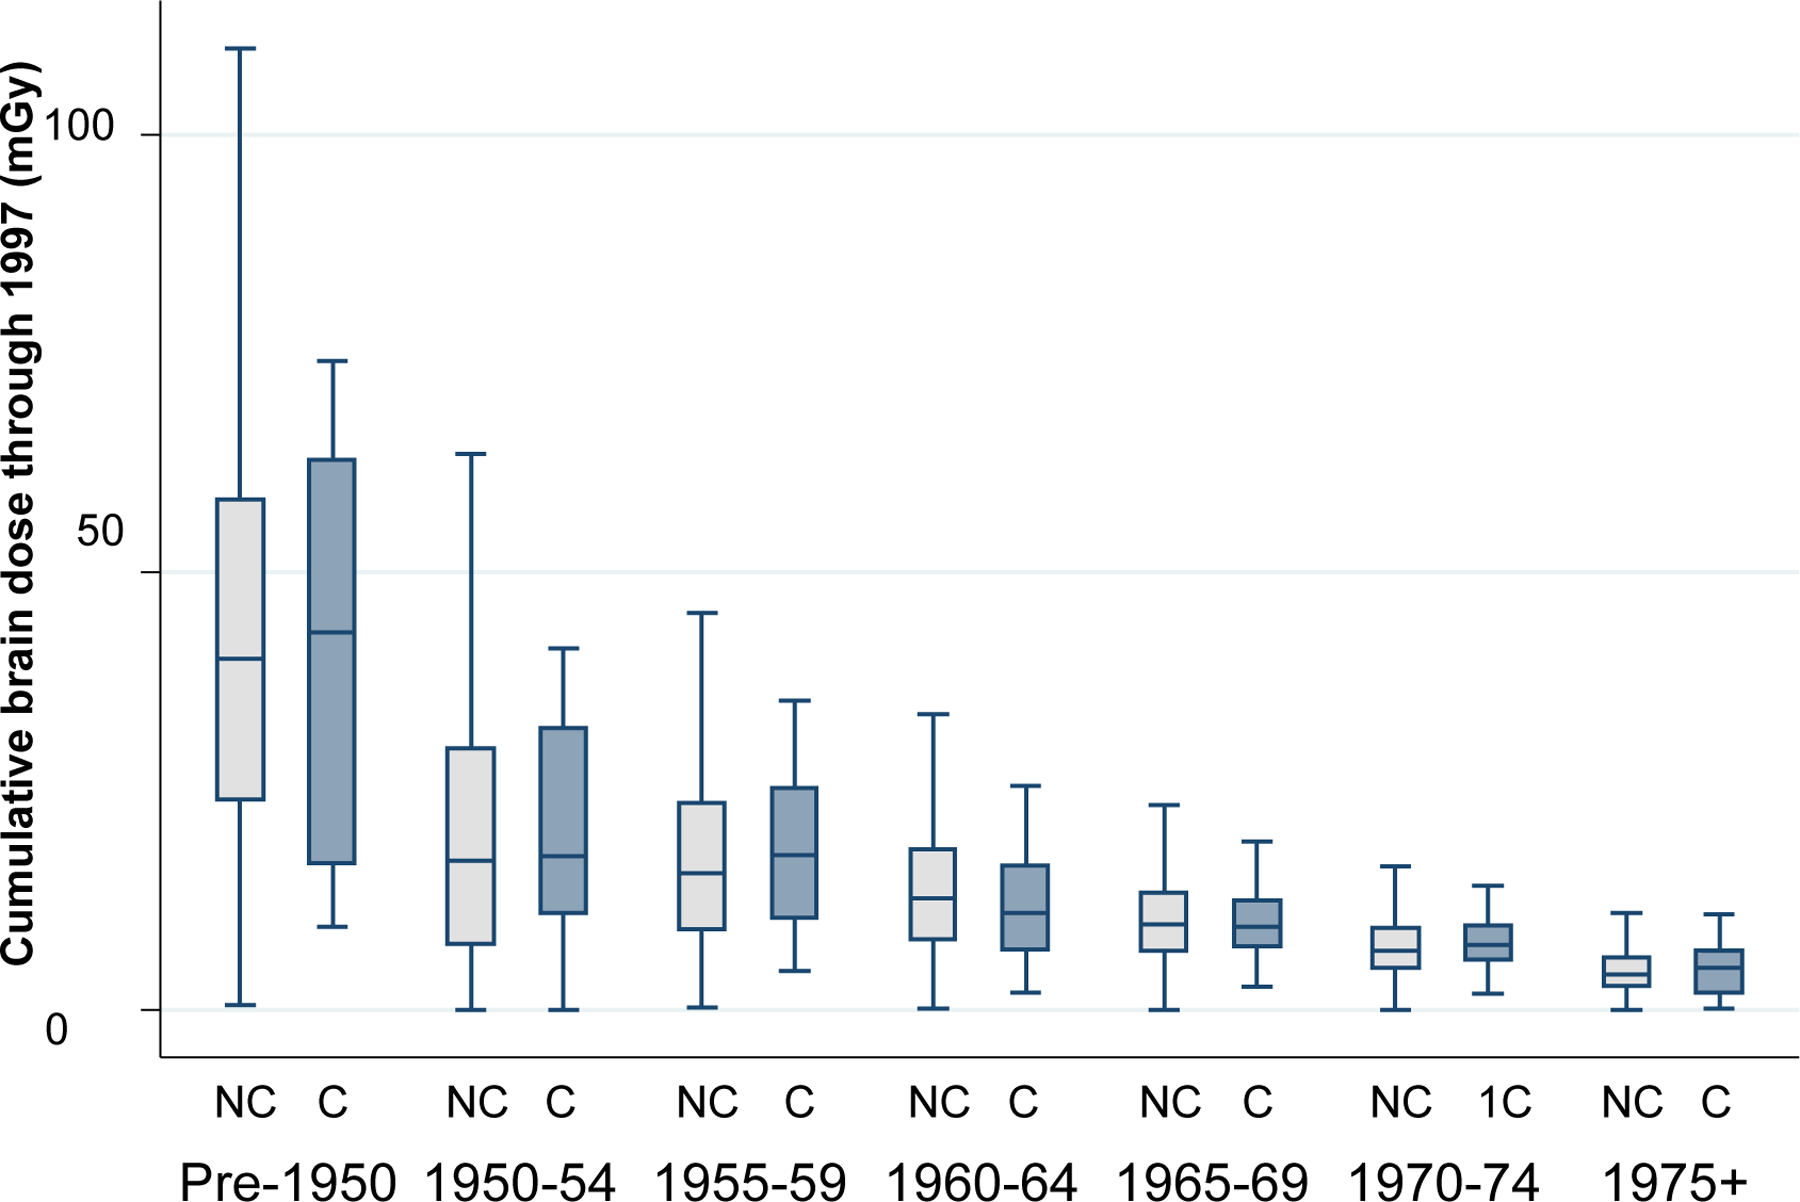
Fig. 1—

Cumulative mean doses to the brain through 1997 (mGy) according to year first worked as a radiologic technologist. Values for cohort participants who died of malignant intracranial neoplasms (cases, C) are shown in the darker-shaded bars and values for non-cases (NC) are shown in the lighter-shaded bars. The horizontal line in the box represents the median, the box represents the interquartile range (IQR), and the upper and lower lines perpendicular to the whiskers represent the upper (75th percentile plus 1.5*IQR) and lower (25th percentile minus 1.5*IQR) adjacent values, respectively.
