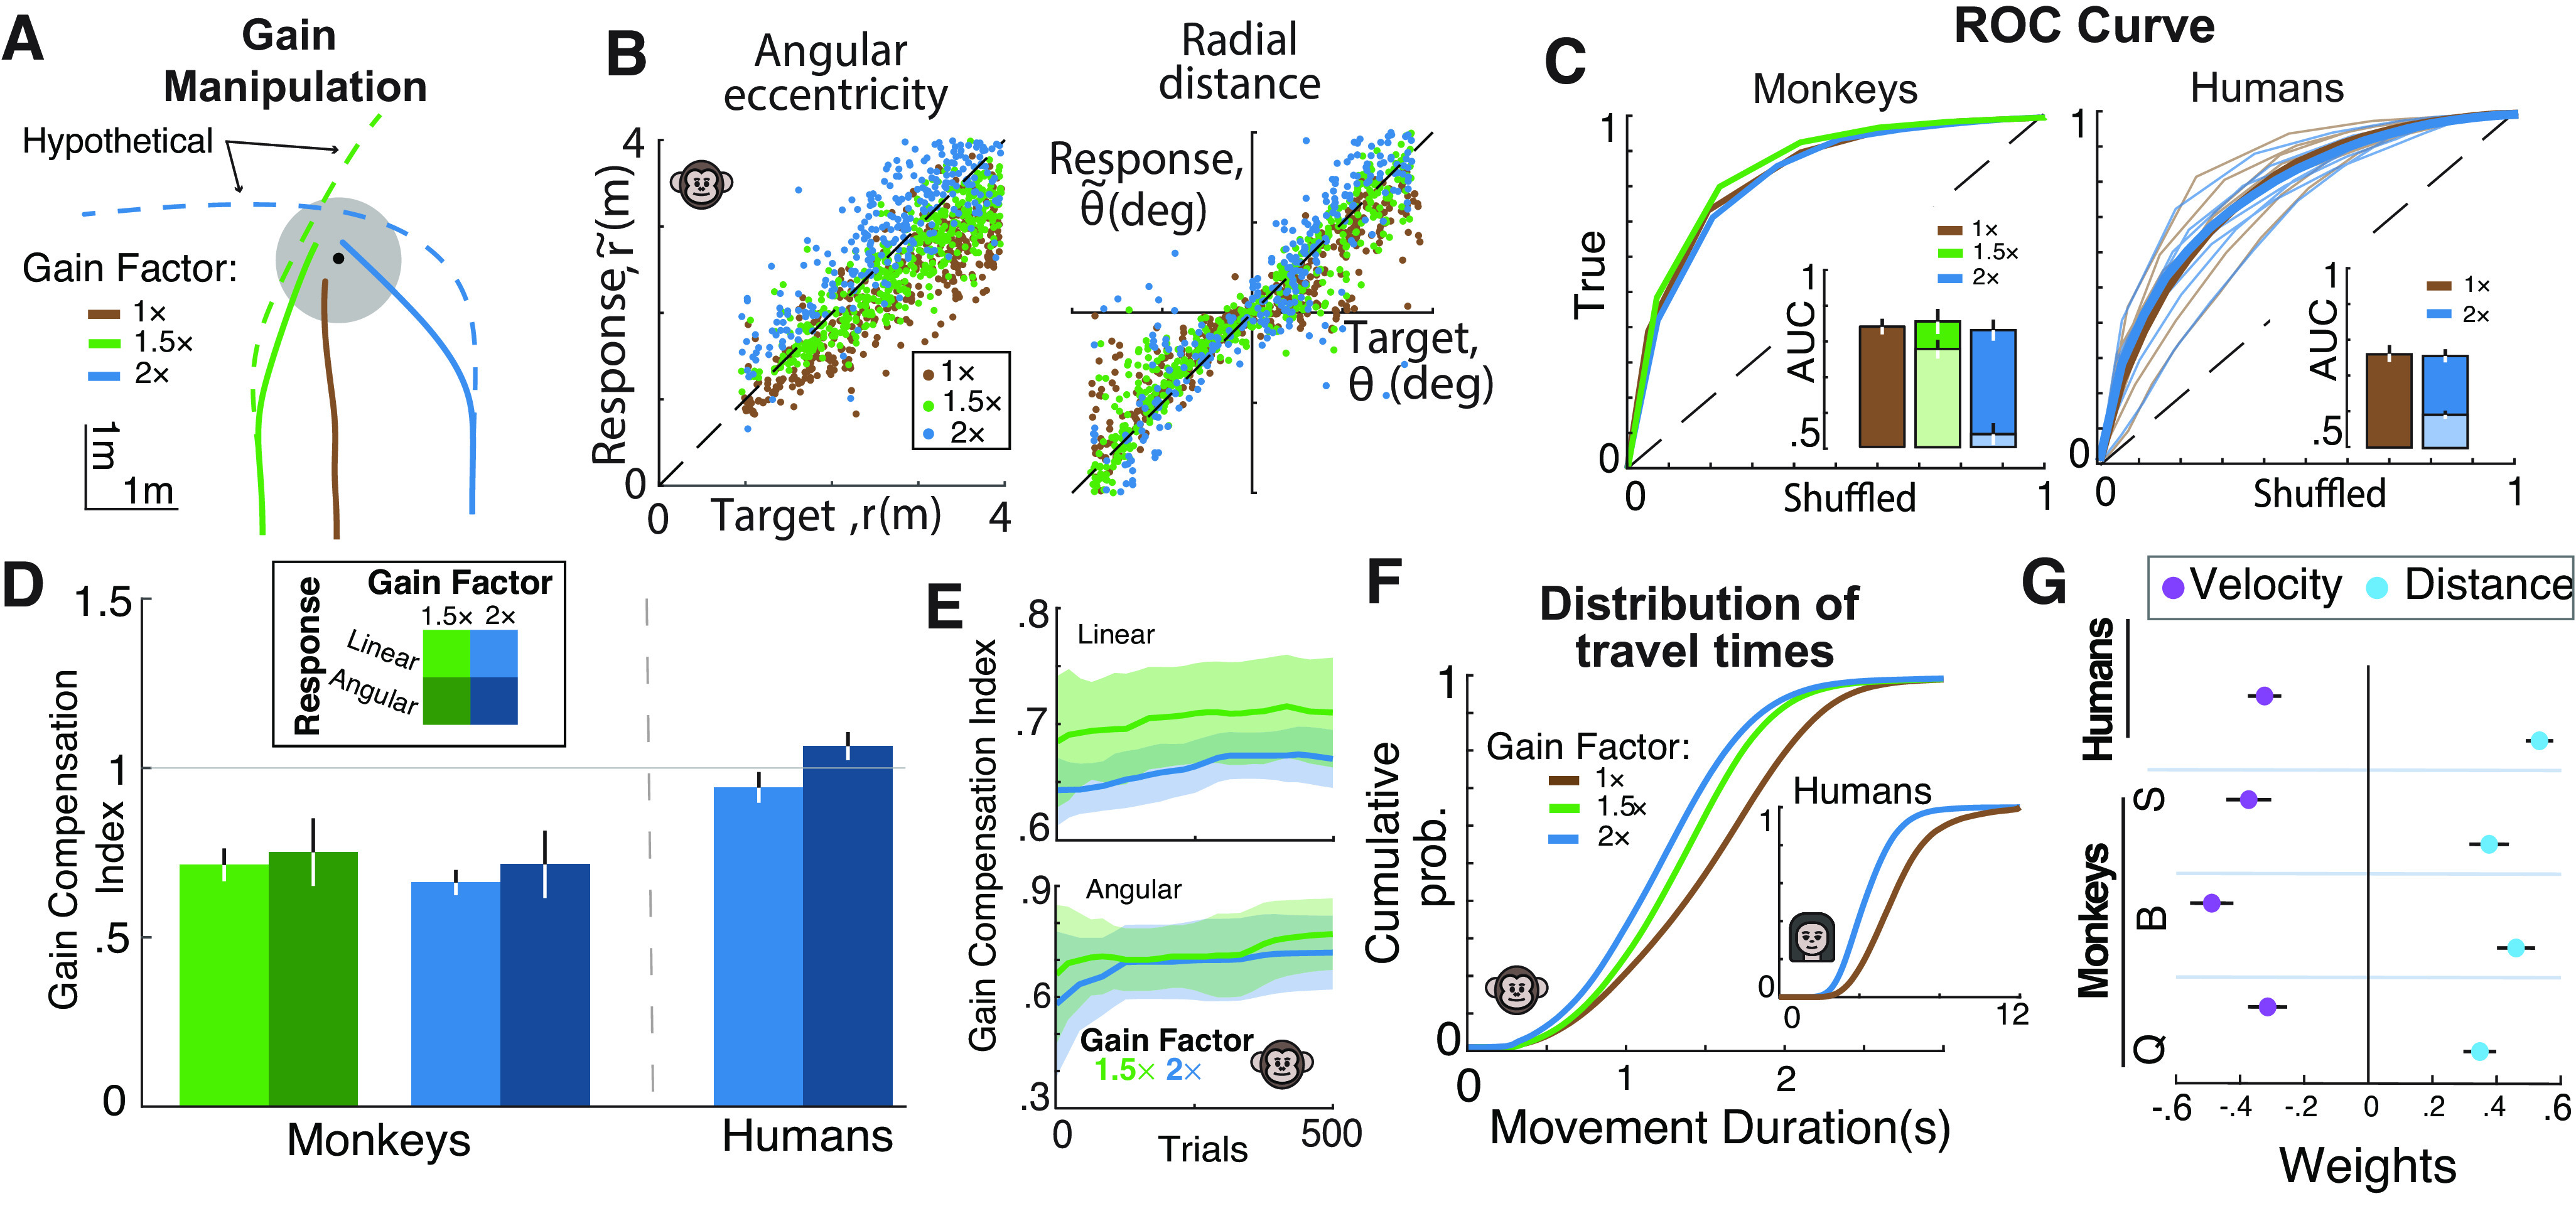
Figure 5.

Subjects adjust their responses to different values of joystick controller gain. A, Steering trajectories to an example target (black dot) with joystick gain factor ×1 (solid brown curve), ×1.5 (solid green curve), and ×2 (solid blue curve). Dashed green and blue curves represent the hypothetical (uncompensated) trajectories with no compensation. B, Radial (left) and angular (right) responses of an example monkey during trials from different gain conditions (brown, 1×; green, 1.5×; blue, 2×). C, ROC curves of all monkeys (left) and humans (right) obtained by plotting the proportion of correct trials against the corresponding chance-level proportion from shuffled data. Inset, Area under the curve for real data (dark blue/green) and uncompensated trajectories (light blue/green). D, Bar plot of the mean gain compensation index for monkey and human subjects. Green and blue colors represent gain factor ×1.5 and 2, respectively, and color saturation denotes response type (light color, linear; dark color, angular). Gray horizontal line denotes GCI value of 1. E, Mean gain compensation index in monkeys as a function of trial number for linear (top) and angular (bottom) response and gain factor 1.5 (green) and 2 (blue). Error bars are ±1 SEM. F, Cumulative distribution of travel time for all monkeys (inset, humans) under different gain conditions. G, Coefficients of regression model [] capturing the effects of gain and distance on travel time. Filled circles represent regression weights of distance (cyan) and gain (purple).
