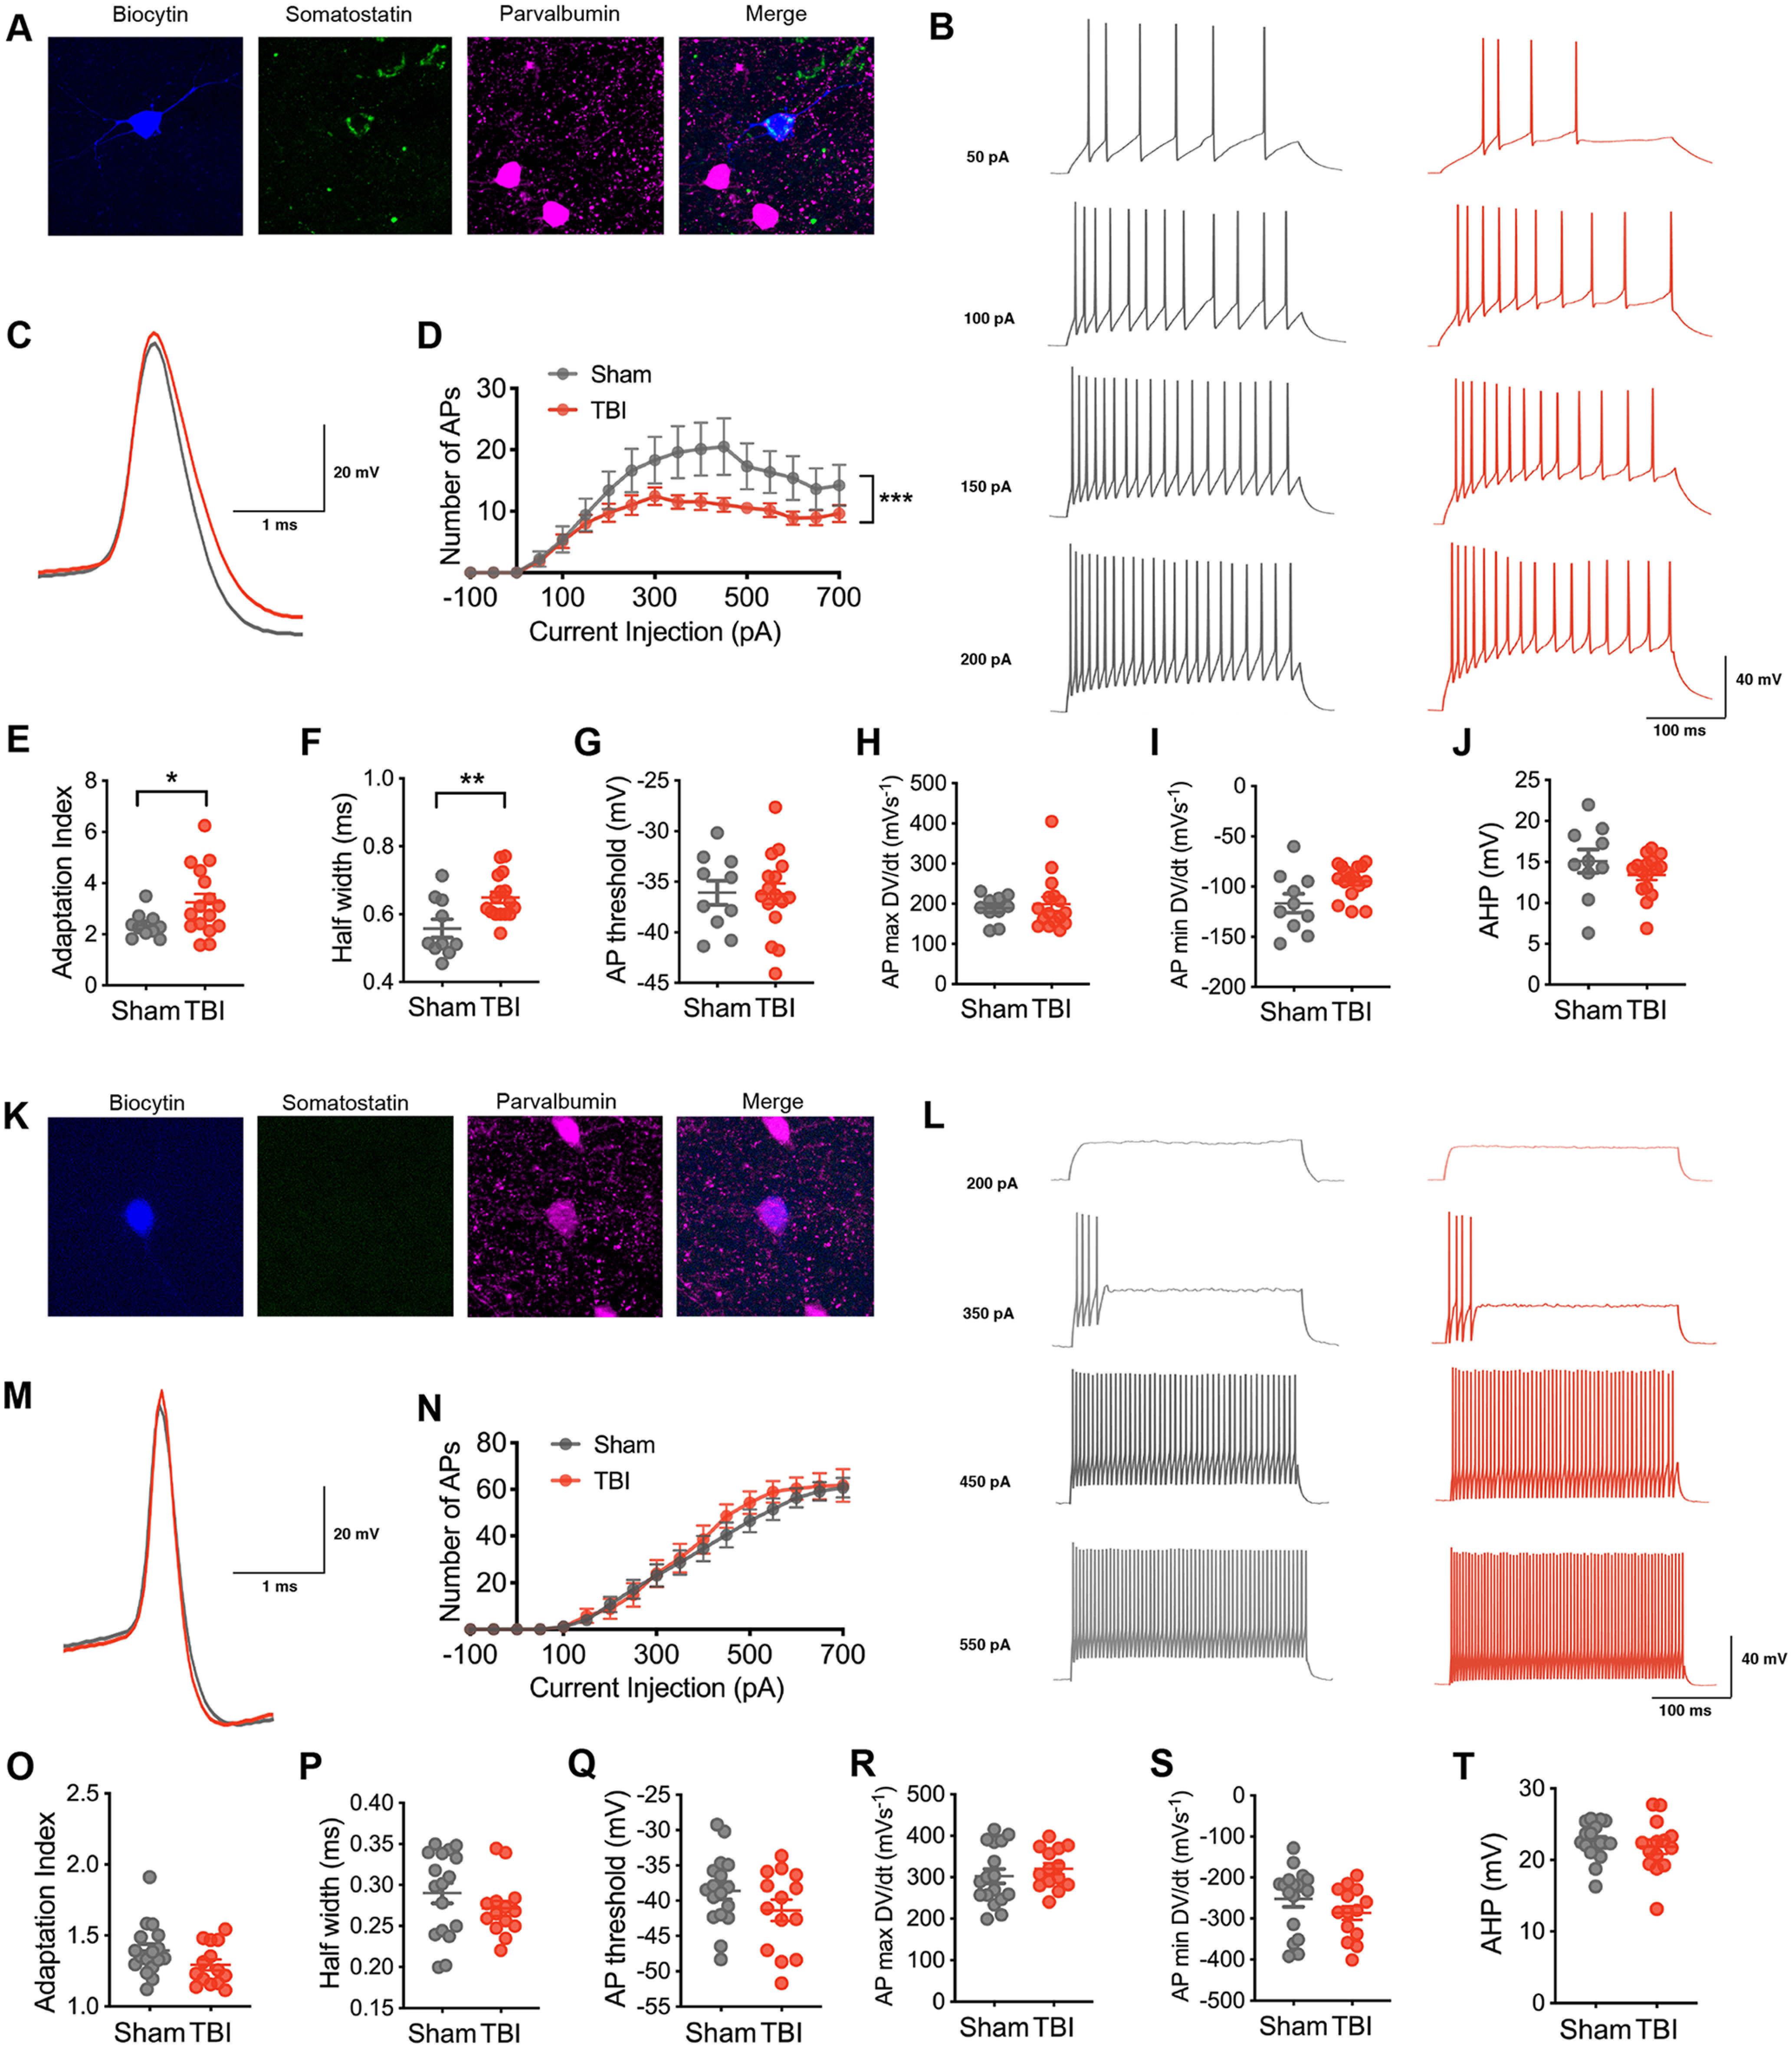
Figure 1.

Selective vulnerability of intrinsic excitability in non-fast-spiking inhibitory neurons after chronic TBI. A, A non-fast-spiking interneuron in layer V of the orbitofrontal cortex that was filled with biocytin (blue) and later confirmed to express somatostatin (green) and not parvalbumin (pink). B, Representative current-clamp responses to depolarizing current steps in sham (gray) and TBI (red) mice. C, Average action potential shape. D, The number of action potentials plotted as a function of current injection (F(1,24) = 5.117, p = 0.0330 for TBI effect, and ***F(18,432) = 2.427, p = 0.0010 for interaction between current and TBI, repeated measures 2-way ANOVA). E, The adaptation index from current-clamp responses measured at 400 pA above spiking threshold (*p = 0.0226, unpaired t test with Welch's correction). F–J, The action potential (AP) half width, AP threshold, AP maximum rising slope, AP minimum falling slope, and AHP calculated from current-clamp responses 100 pA above spiking threshold (**p = 0.0053, unpaired t test; p = 0.9529, unpaired t test; p = 0.7366, Mann–Whitney test; p = 0.0530, unpaired t test with Welch's correction; p = 0.2323, unpaired t test, respectively). K, A fast-spiking interneuron in layer V of the orbitofrontal cortex that was filled with biocytin (blue) and later confirmed to express parvalbumin (pink) and not somatostatin (green). L, Representative current-clamp responses to depolarizing current steps in sham (gray) and TBI (red) mice. M, Average action potential shape. N, The number of action potentials plotted as a function of current injection (F(1,29) = 0.2705, p = 0.6069 for TBI effect, repeated measures 2-way ANOVA). O, The adaptation index from current-clamp responses measured at 400 pA above spiking threshold (p = 0.0994, unpaired t test). P–T, The AP half width, threshold, maximum rising slope, and minimum falling slope, and AHP calculated from current-clamp responses 100 pA above spiking threshold (p = 0.2574, unpaired t test; p = 0.1614, unpaired t test; p = 0.4253, unpaired t test; p = 0.2010, unpaired t test; p = 0.5087, unpaired t test, respectively). Each neuron is represented with a symbol; solid lines indicate the mean ± SEM [n = 10 sham and 16 TBI non-fast-spiking neurons from 7 (sham) and 8 (TBI) animals/group; n = 17 sham and 14 TBI fast-spiking neurons from 9 (sham) and 7 (TBI) animals/group].
