
Figure 4.
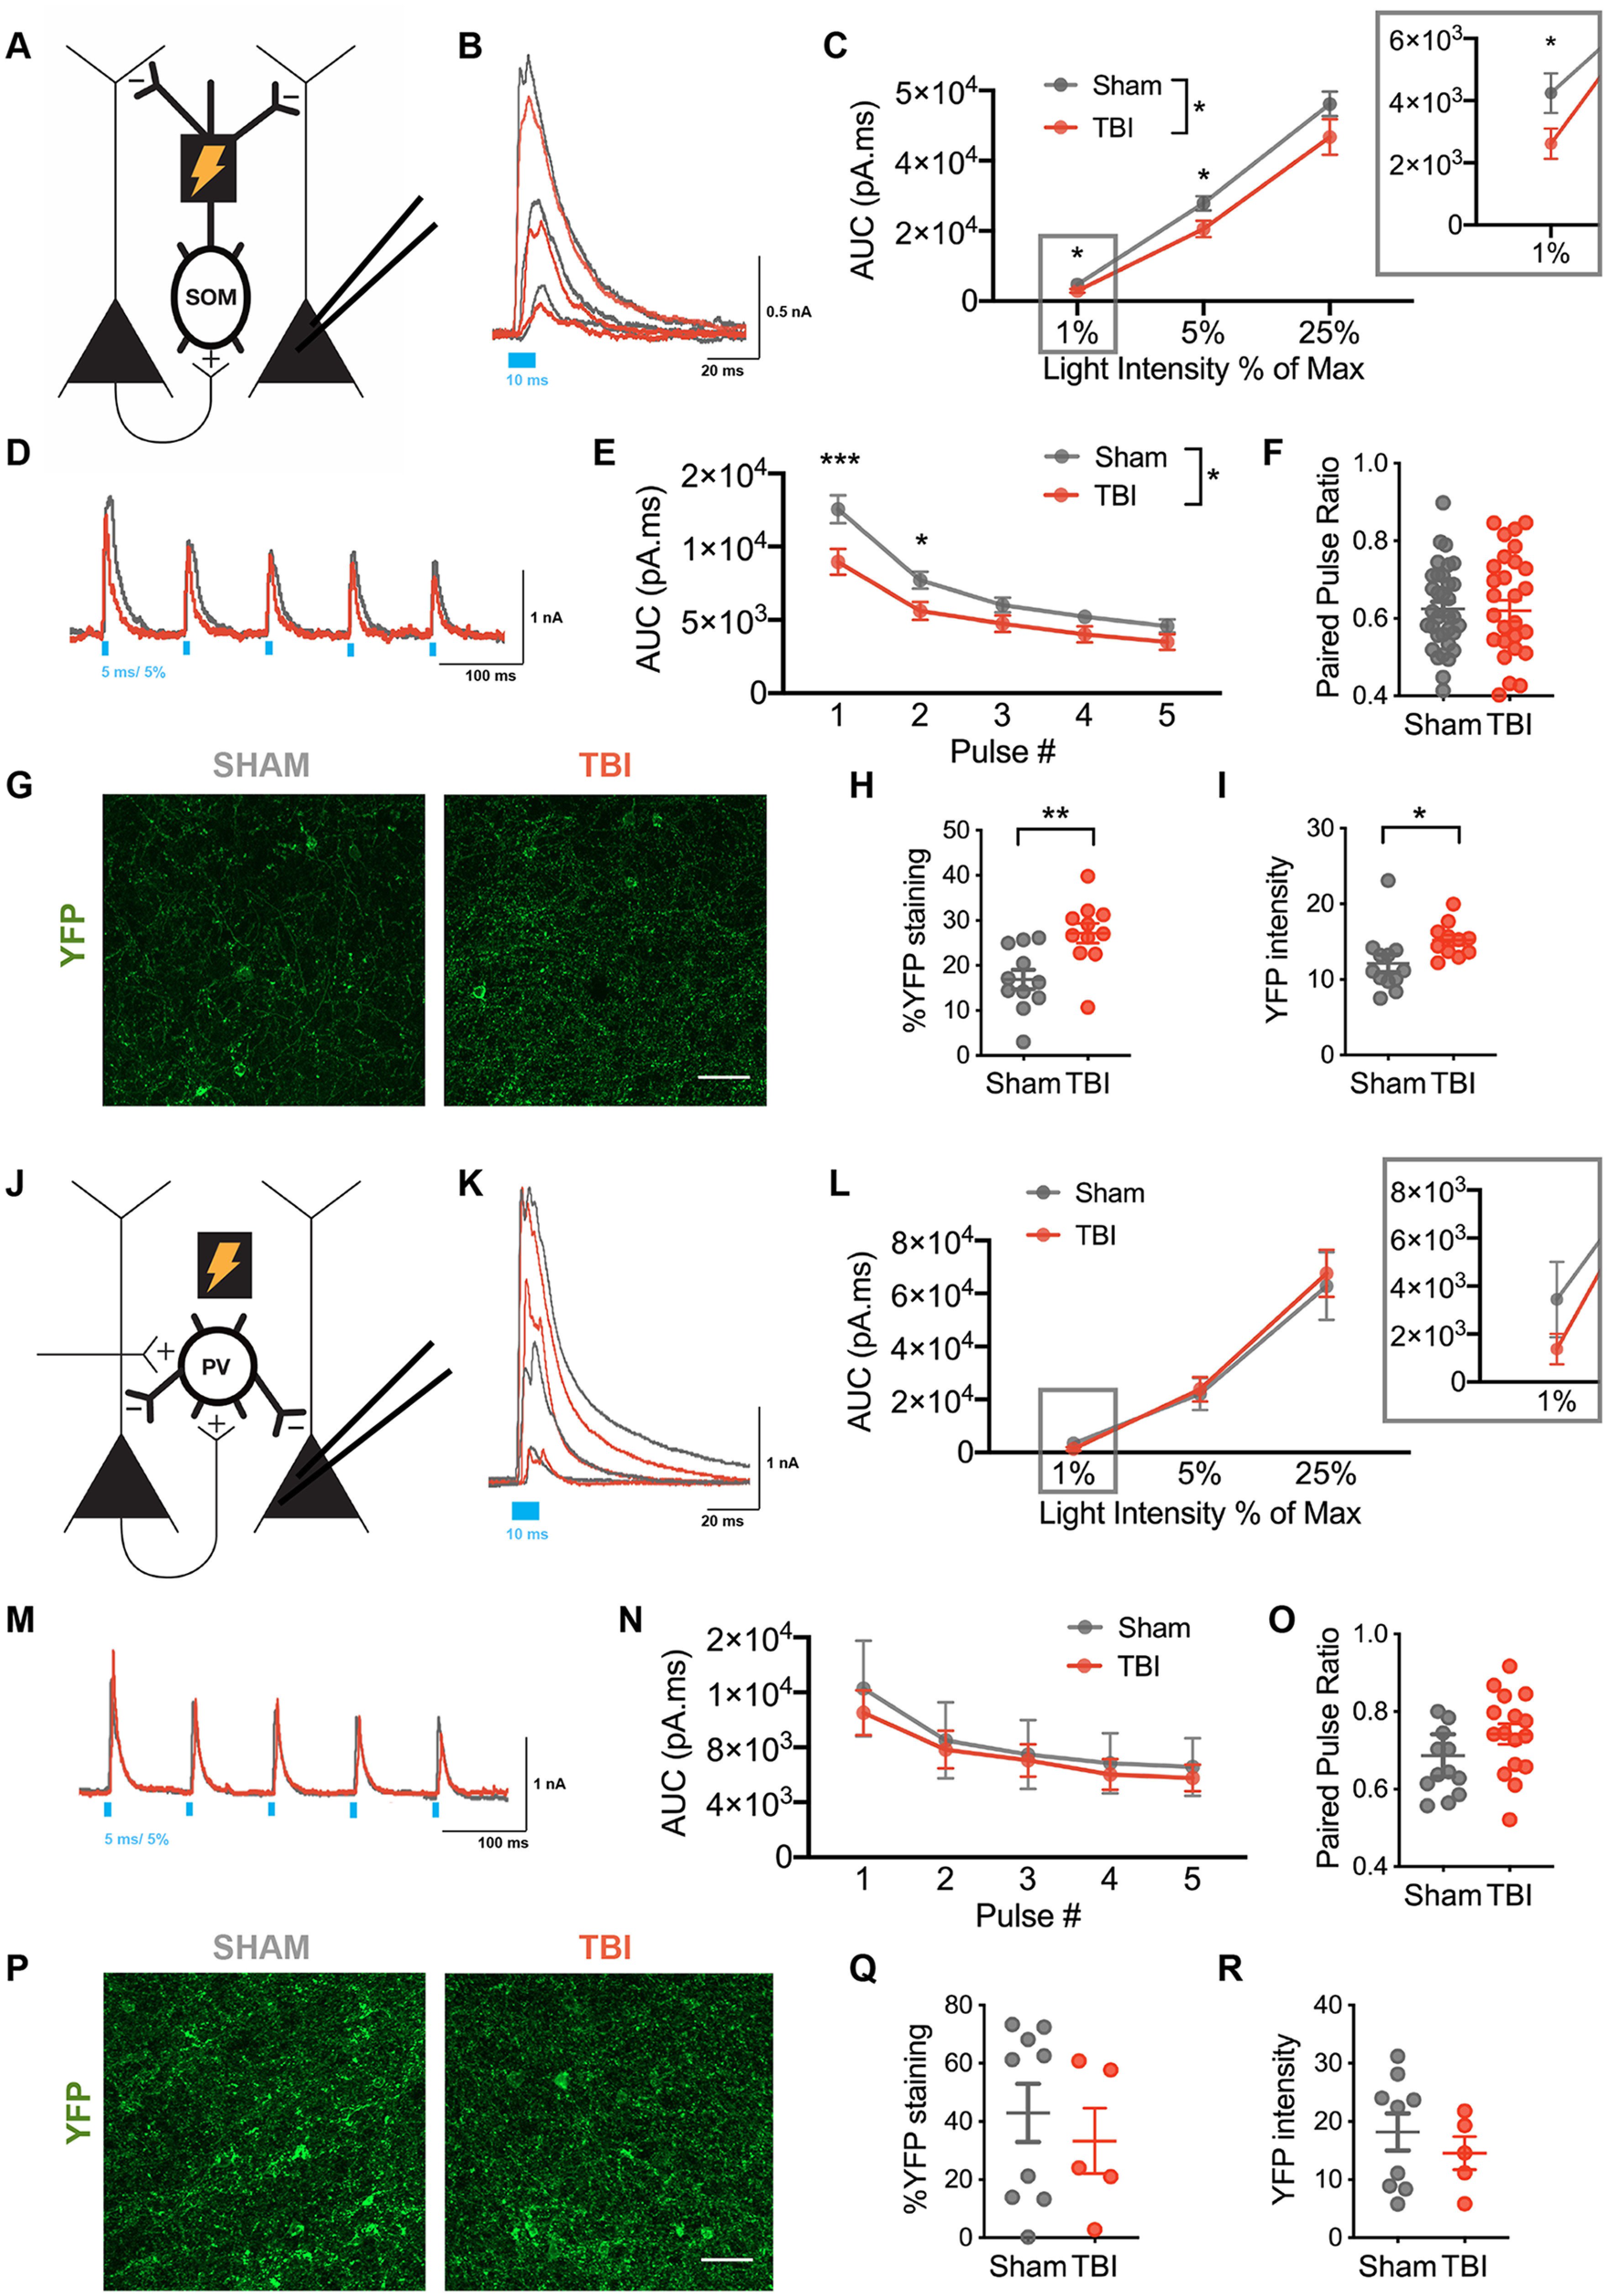
Selective reduced SOM+-mediated inhibitory synaptic output on layer V pyramidal neurons after TBI. A, Schematic of experimental design; voltage-clamp recordings were obtained from layer V pyramidal neurons while activating ChR2-expressing SOM+ interneurons. B, Example oIPSCs recorded from pyramidal neurons in sham (gray) and TBI (red) conditions in response to 10 ms light pulses of increasing intensity [40 μW (1%), 225 μW (5%), and 1 mW/mm2 (25%)]. C, Total charge (AUC) of oIPSC across light intensities (*F(1,62) = 4.665, p = 0.0347 for TBI effect, mixed effects model; *p < 0.05, post hoc tests controlling for the false discovery rate). D, Example oIPSCs in sham (gray) and TBI (red) conditions elicited with 10 Hz stimulation. E, Total charge (AUC) of oIPSCs elicited across pulse number (*F(1, 62) = 5.055, p = 0.0281 for TBI effect, repeated measures 2-way ANOVA; ***p < 0.0001, *p = 0.0189, post hoc tests controlling for the false discovery rate). F, The paired-pulse ratio determined as the ratio of pulse 2/pulse 1 (p = 0.8864, unpaired t test). G, Representative EYFP expression in layer V OFC in sham and TBI slices. H, Percentage area staining after binary thresholding (**p = 0.0032, unpaired t test). I, Average EYFP intensity (*p = 0.0386, unpaired t test). J, Schematic of experimental design. Voltage-clamp recordings were obtained from layer V pyramidal neurons while activating ChR2-expressing PV+ interneurons. K, Example oIPSCs recorded from pyramidal neurons in sham (gray) and TBI (red) conditions in response to 10 ms light pulses of increasing intensity [40 μW (1%), 225 μW (5%), and 1 mW/mm2 (25%)]. L, Total charge (AUC) of oIPSC across light intensities (F(1,31) = 0.036, p = 0.8501 for TBI effect, repeated measures 2-way ANOVA). M, Example oIPSCs in sham (gray) and TBI (red) conditions elicited with 10 Hz stimulation. N, Total charge (AUC) of oIPSC elicited across pulse number (F(1,31) = 1.289, p = 0.2649 for TBI effect, repeated measures 2-way ANOVA). O, The paired-pulse ratio determined as the ratio of pulse 2/pulse 1 (p = 0.0771; unpaired t test). P, Representative EYFP expression in layer V OFC in sham and TBI slices. Q, Percentage area staining after binary thresholding (p = 0.5545 unpaired t test). R, Average EYFP intensity (p = 0.4649, unpaired t test). Circles represent mean; solid lines indicate SEM in C, E, L, N. Each neuron/slice is represented with a symbol, and solid lines indicate the mean ± SEM in F, H, I, O, Q, R [n = 34 sham and 30 TBI neurons from 7 (sham) and 6 (TBI) animals/group for oIPSC data from SOM+ stimulation; n = 12 sham and 11 TBI slices for immunohistochemistry for EYFP expression in SOM+ neurons from 4 (sham) and 4 (TBI) animals/group; n = 16 sham and 17 TBI neurons from 4 (sham) and 4 (TBI) animals/group for oIPSC data from PV+ stimulation; n = 9 sham and 5 TBI slices for immunohistochemistry for EYFP expression in PV+ neurons from 3 (sham) and 3 (TBI) animals/group].