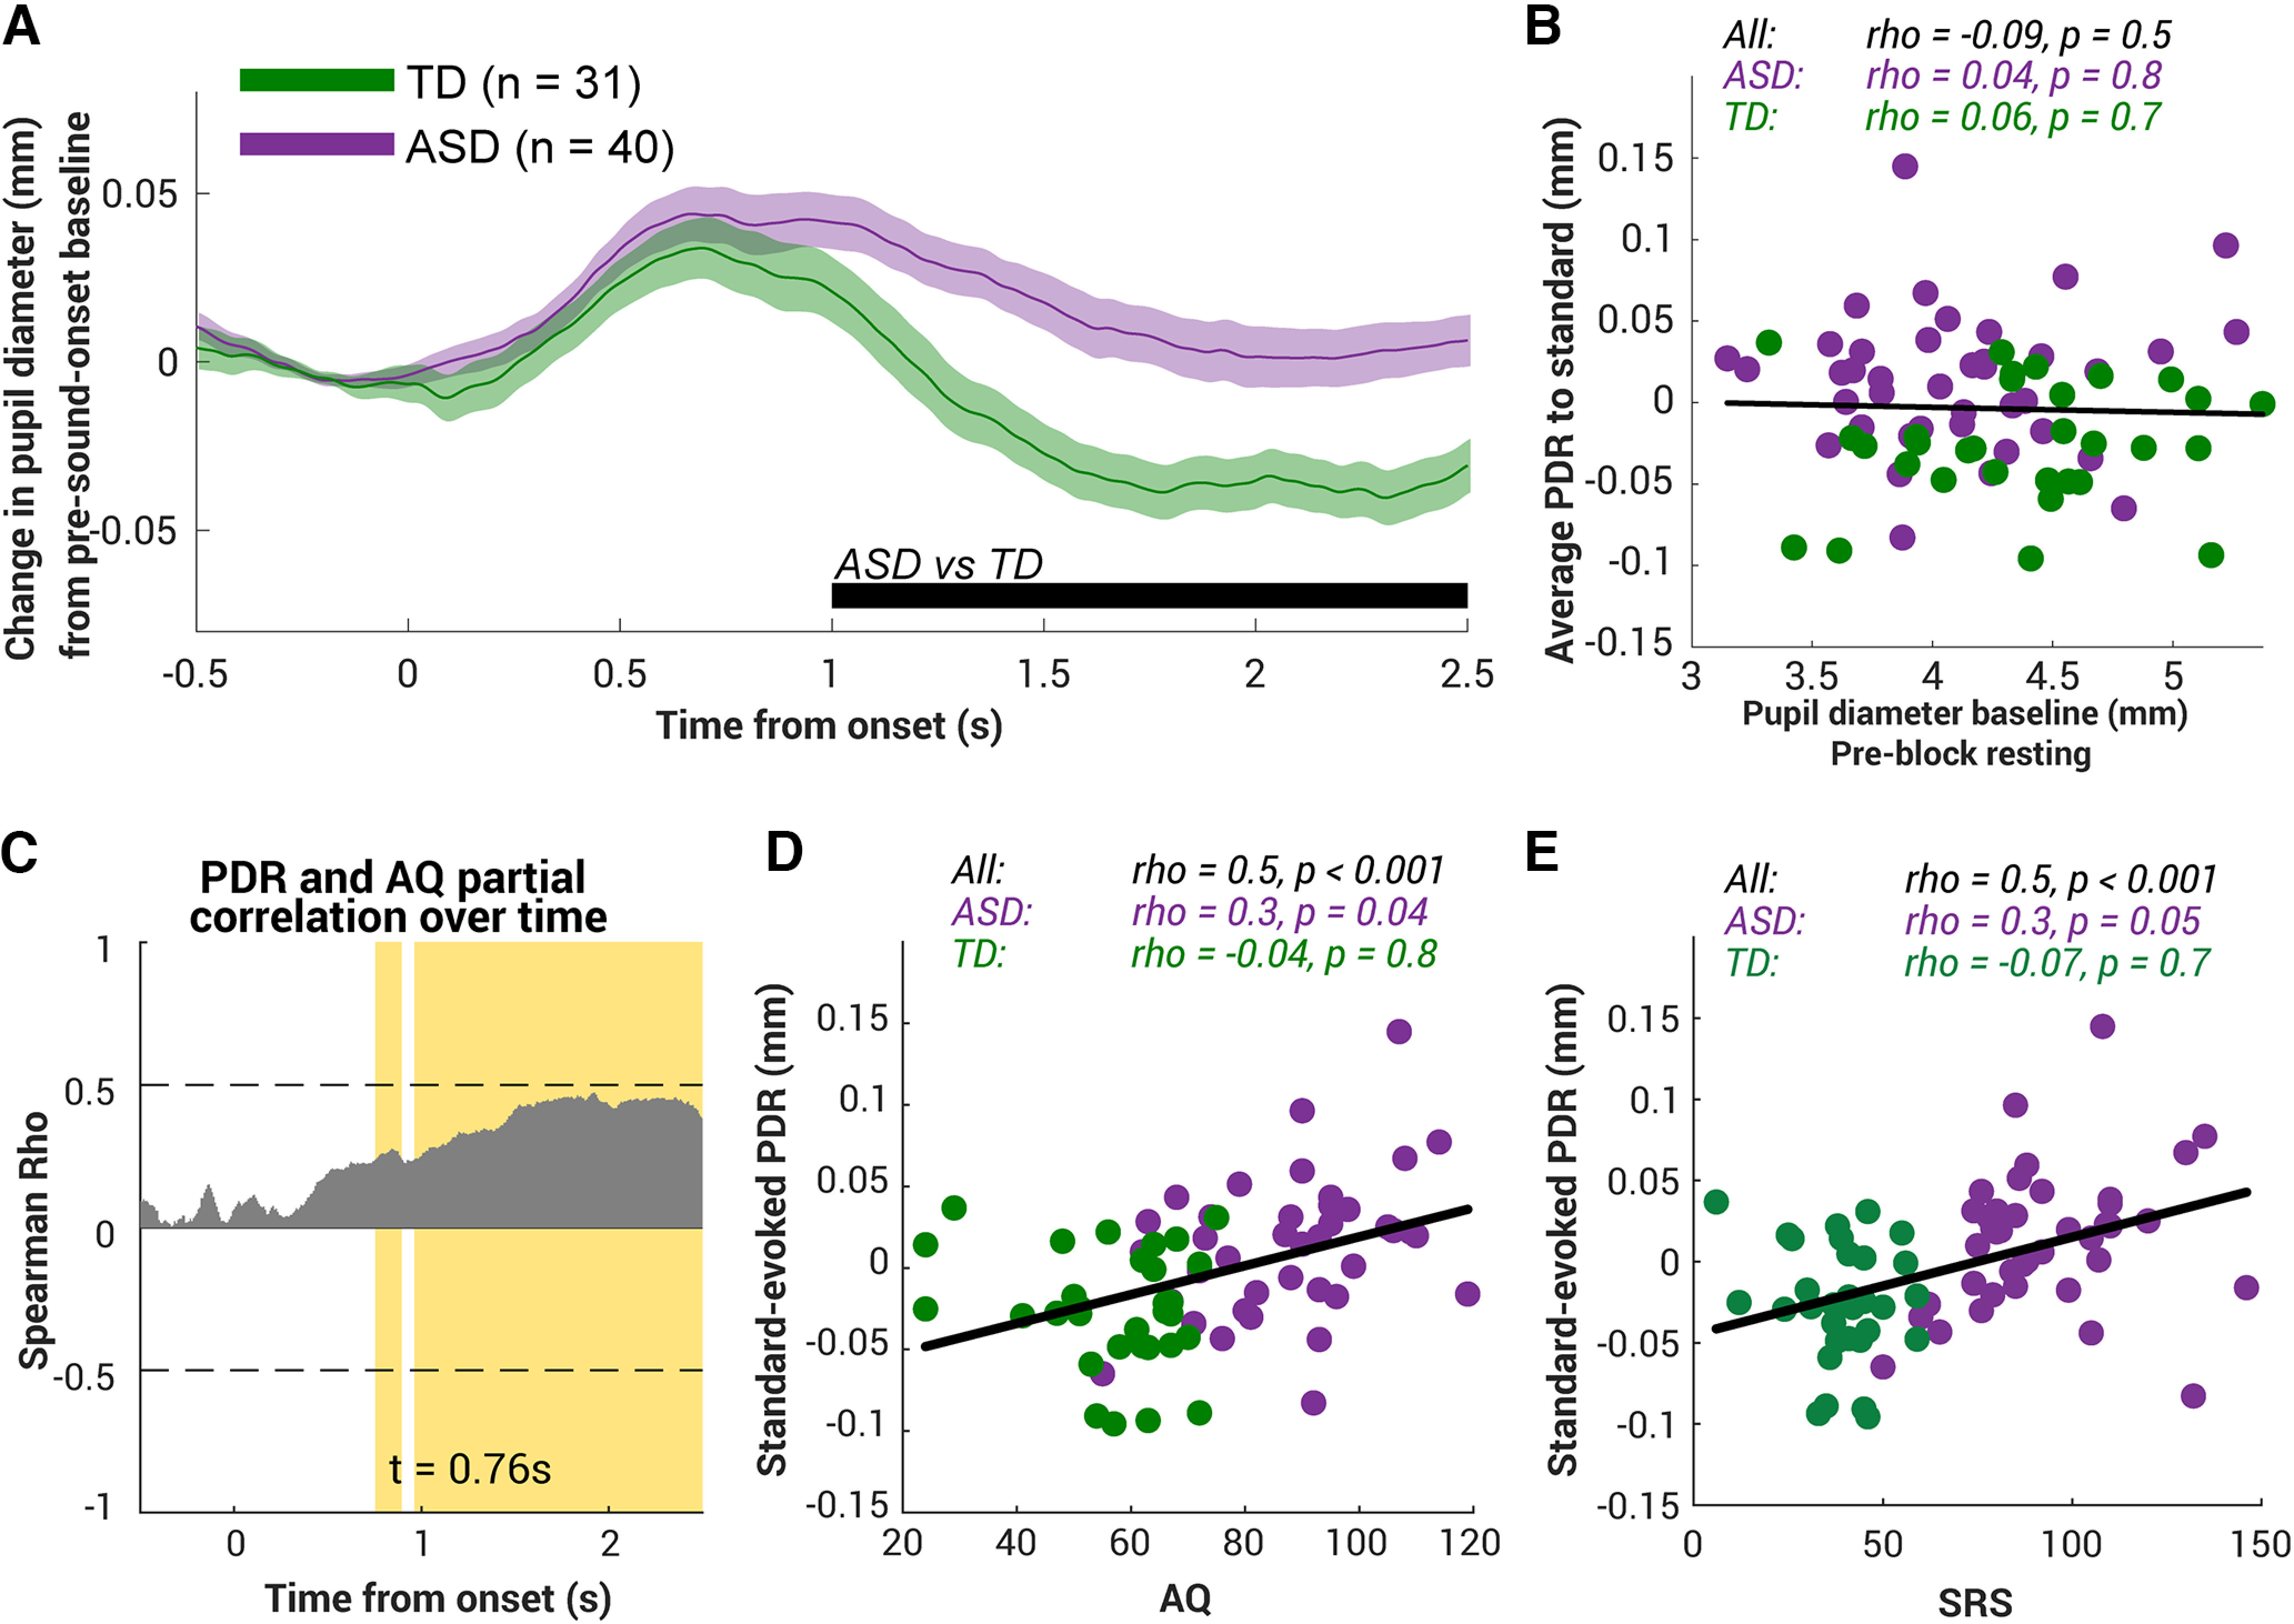
Figure 2.

Standard-evoked pupil dilation responses in ASD and TD children. A, Averaged pupil dilation response to standard in the TD group (N = 31, green) and the ASD group (N = 40, purple). Bottom, The black horizontal line indicates the time interval where bootstrap resampling confirmed a significant difference between groups. The shaded area shows ±1 SEM. B, To investigate whether the difference observed in A is driven by the difference in tonic pupil diameter preblock, we computed the average PDR to standard from 1 s to 2.5 s postonset (the time interval chosen based on the significant interval shown in A). No correlation was found between this average PDR and the pupil diameter baseline. Each dot represents data from a single subject, green indicating the TD group and purple indicating the ASD group. Top, Spearman's correlation coefficients and their two-tailed p values. C, The standard-evoked PDR correlates with the autism-related measure AQ on an individual subject level, after controlling for the subject's age and IQ. Gray bars indicate Spearman's correlation coefficients at each time point. Yellow area indicates the time intervals where a significant correlation (p < 0.05; FWE uncorrected) was observed. This analysis was conducted over the entire trial duration with all significant time points indicated. The t value labels the start of the significant interval. D, E, Standard-evoked pupil dilation response positively correlated with the autistic traits AQ and SRS. Top, Spearman's correlation coefficients and their two-tailed p values.
