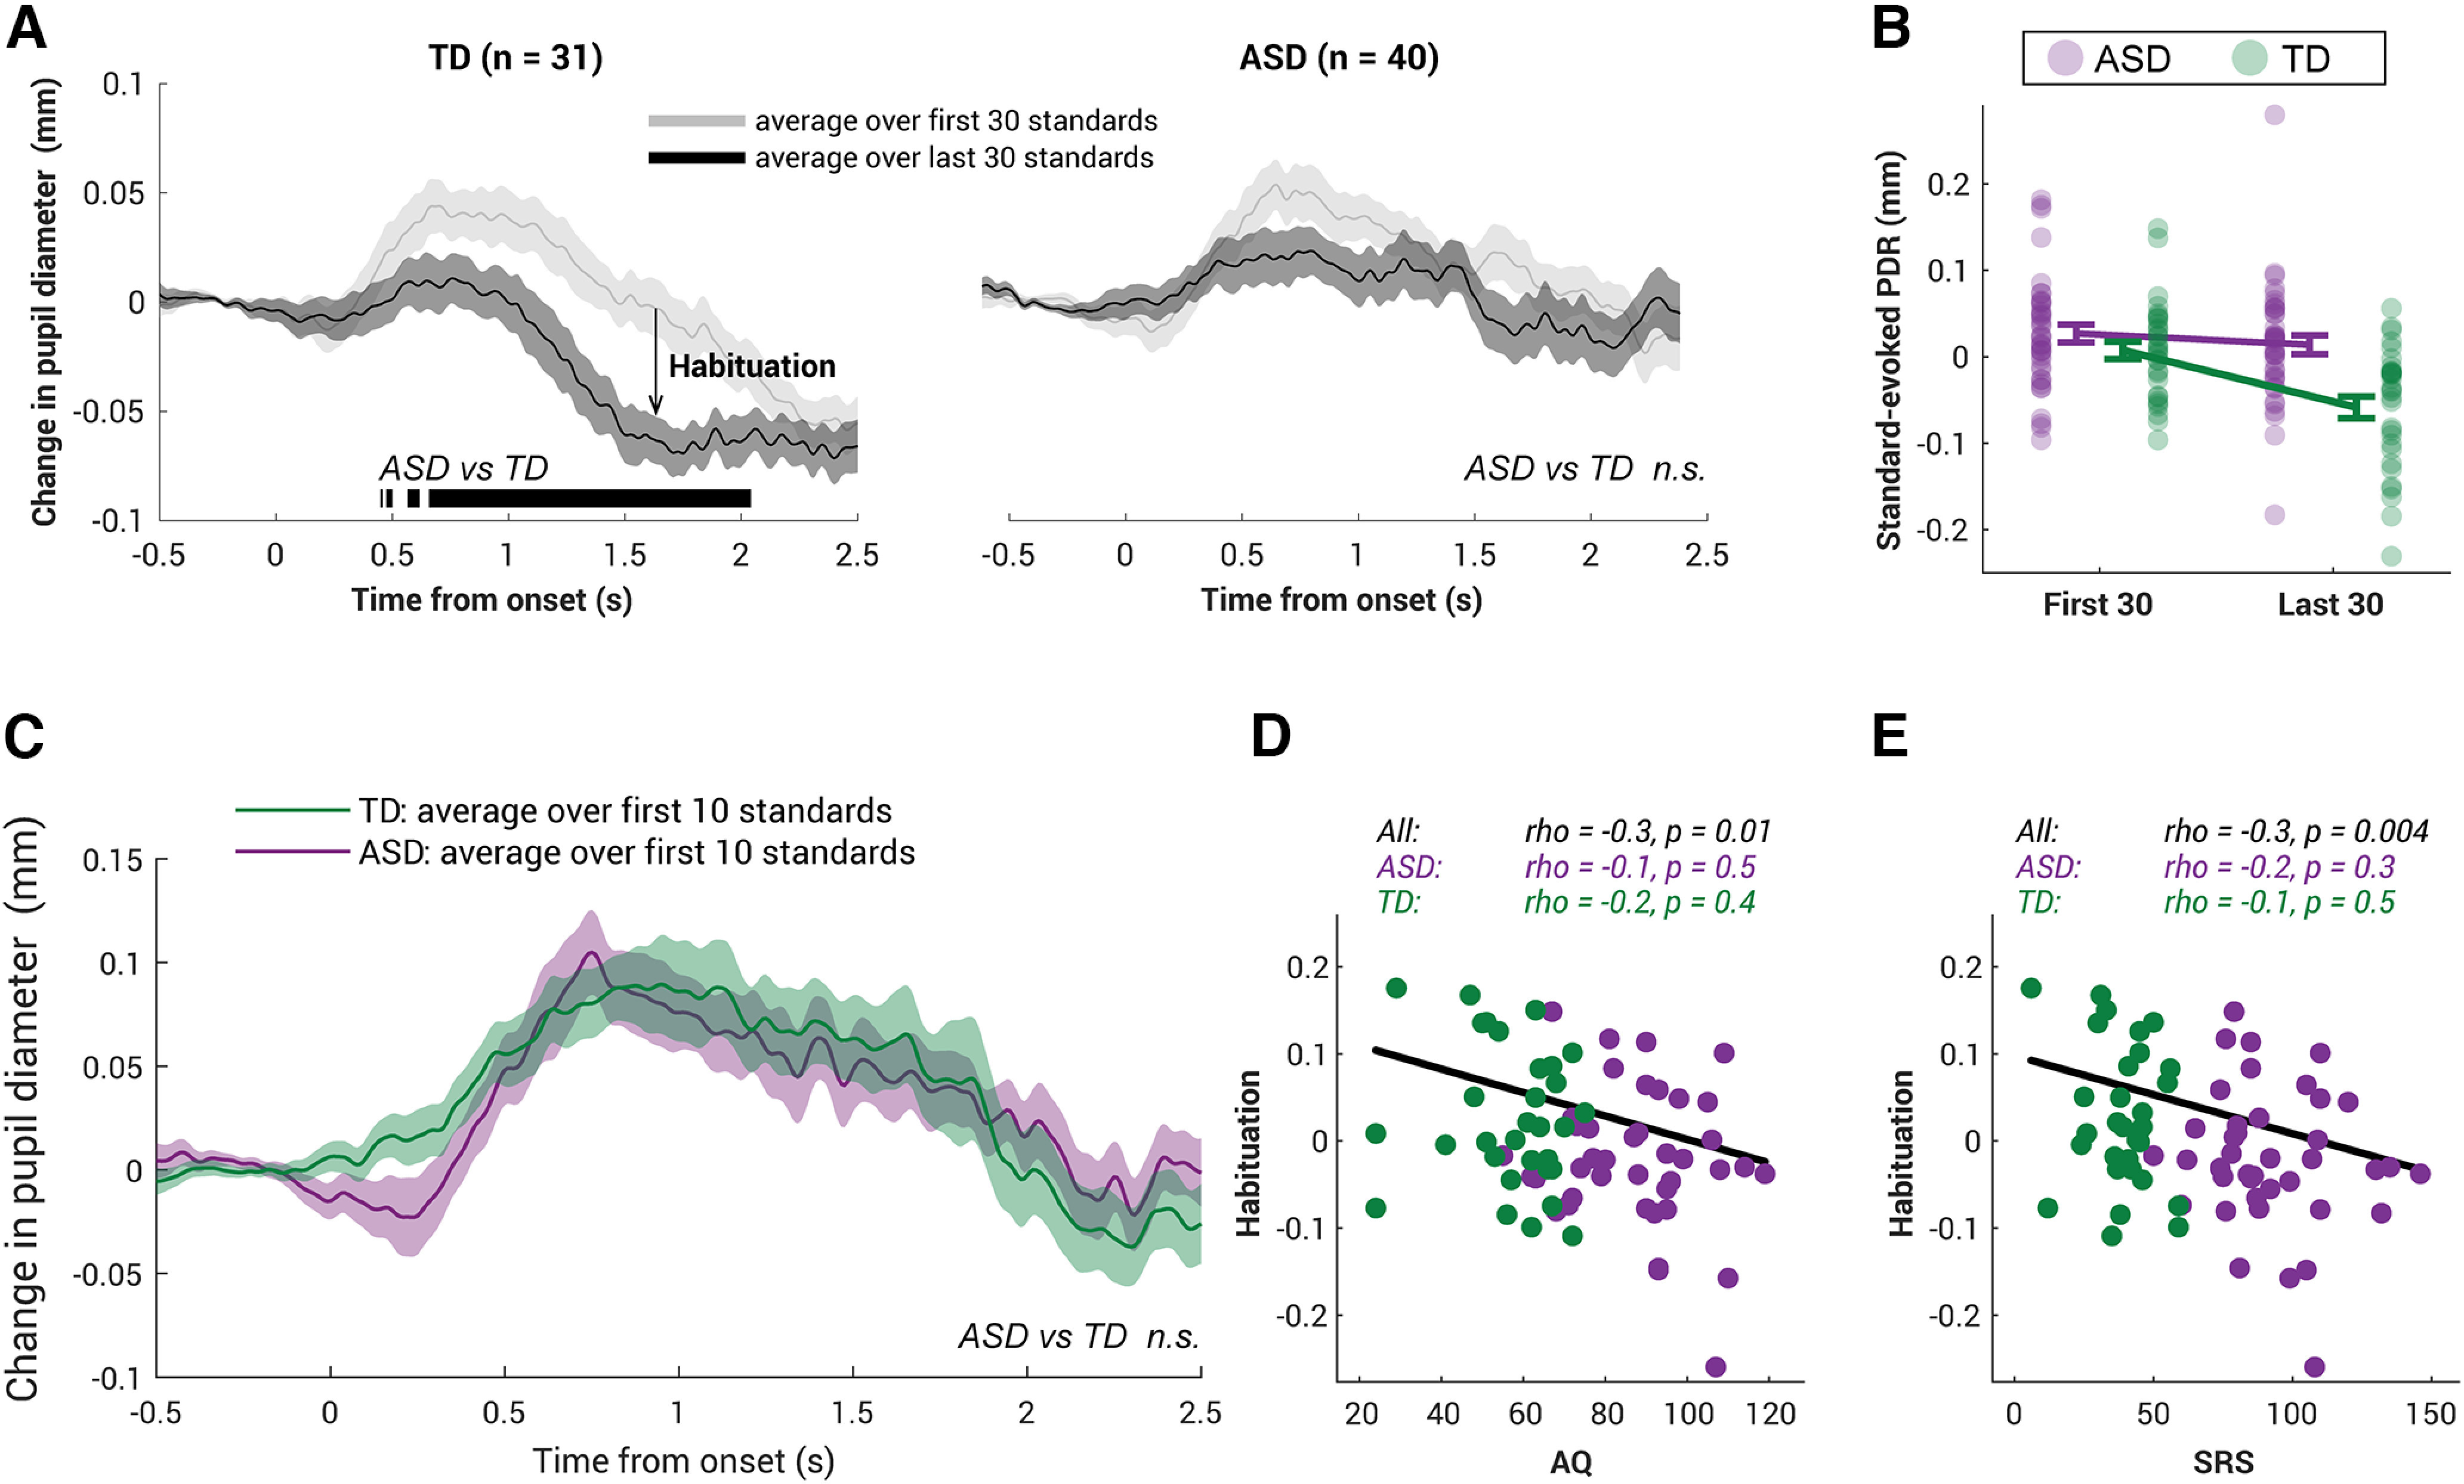
Figure 3.

Habituation in standard-evoked pupil dilation in TD children but not in ASD children. A, Average PDR over the first 30 standard trials (dark gray) versus over the last 30 trials (light gray) for the TD group (left) and the ASD group (right). The solid lines represent the average pupil diameter related to the baseline (0.5 s preonset) as a function of time. Bottom, The black horizontal line indicates the time interval where bootstrap resampling confirmed a significant difference between the first half and the second half of the experiment. The shaded area shows ±1 SEM. n.s., not significant. B, Compared with the ASD group (green), the ASD group (purple) showed a significantly smaller reduction in standard-evoked PDR over time. The error bar is ±1 SEM. Each dot presents individual subject's data from each group. The size of habituation is quantified as the reduction in the standard-evoked PDR averaged over the epoch, namely subtracting the average amplitude of the last 30 trials from that of the first 30 trials for each subject. C, The first 10-trial standard-evoked pupil dilation response did not differ across ASD and TD groups. Permutation-based time-series analysis was done throughout the epoch, but no statistically significant intervals were found (p > 0.05). The shaded area shows ±1 SEM. D, E, The size of the habituation in standard-evoked PDR is negatively correlated with the autism-related measures—AQ in D and SRS in E— on an individual subject level. Each dot represents data from a single subject, green indicating the TD group and purple indicating the ASD group. Top, Spearman's correlation statistics are reported.
