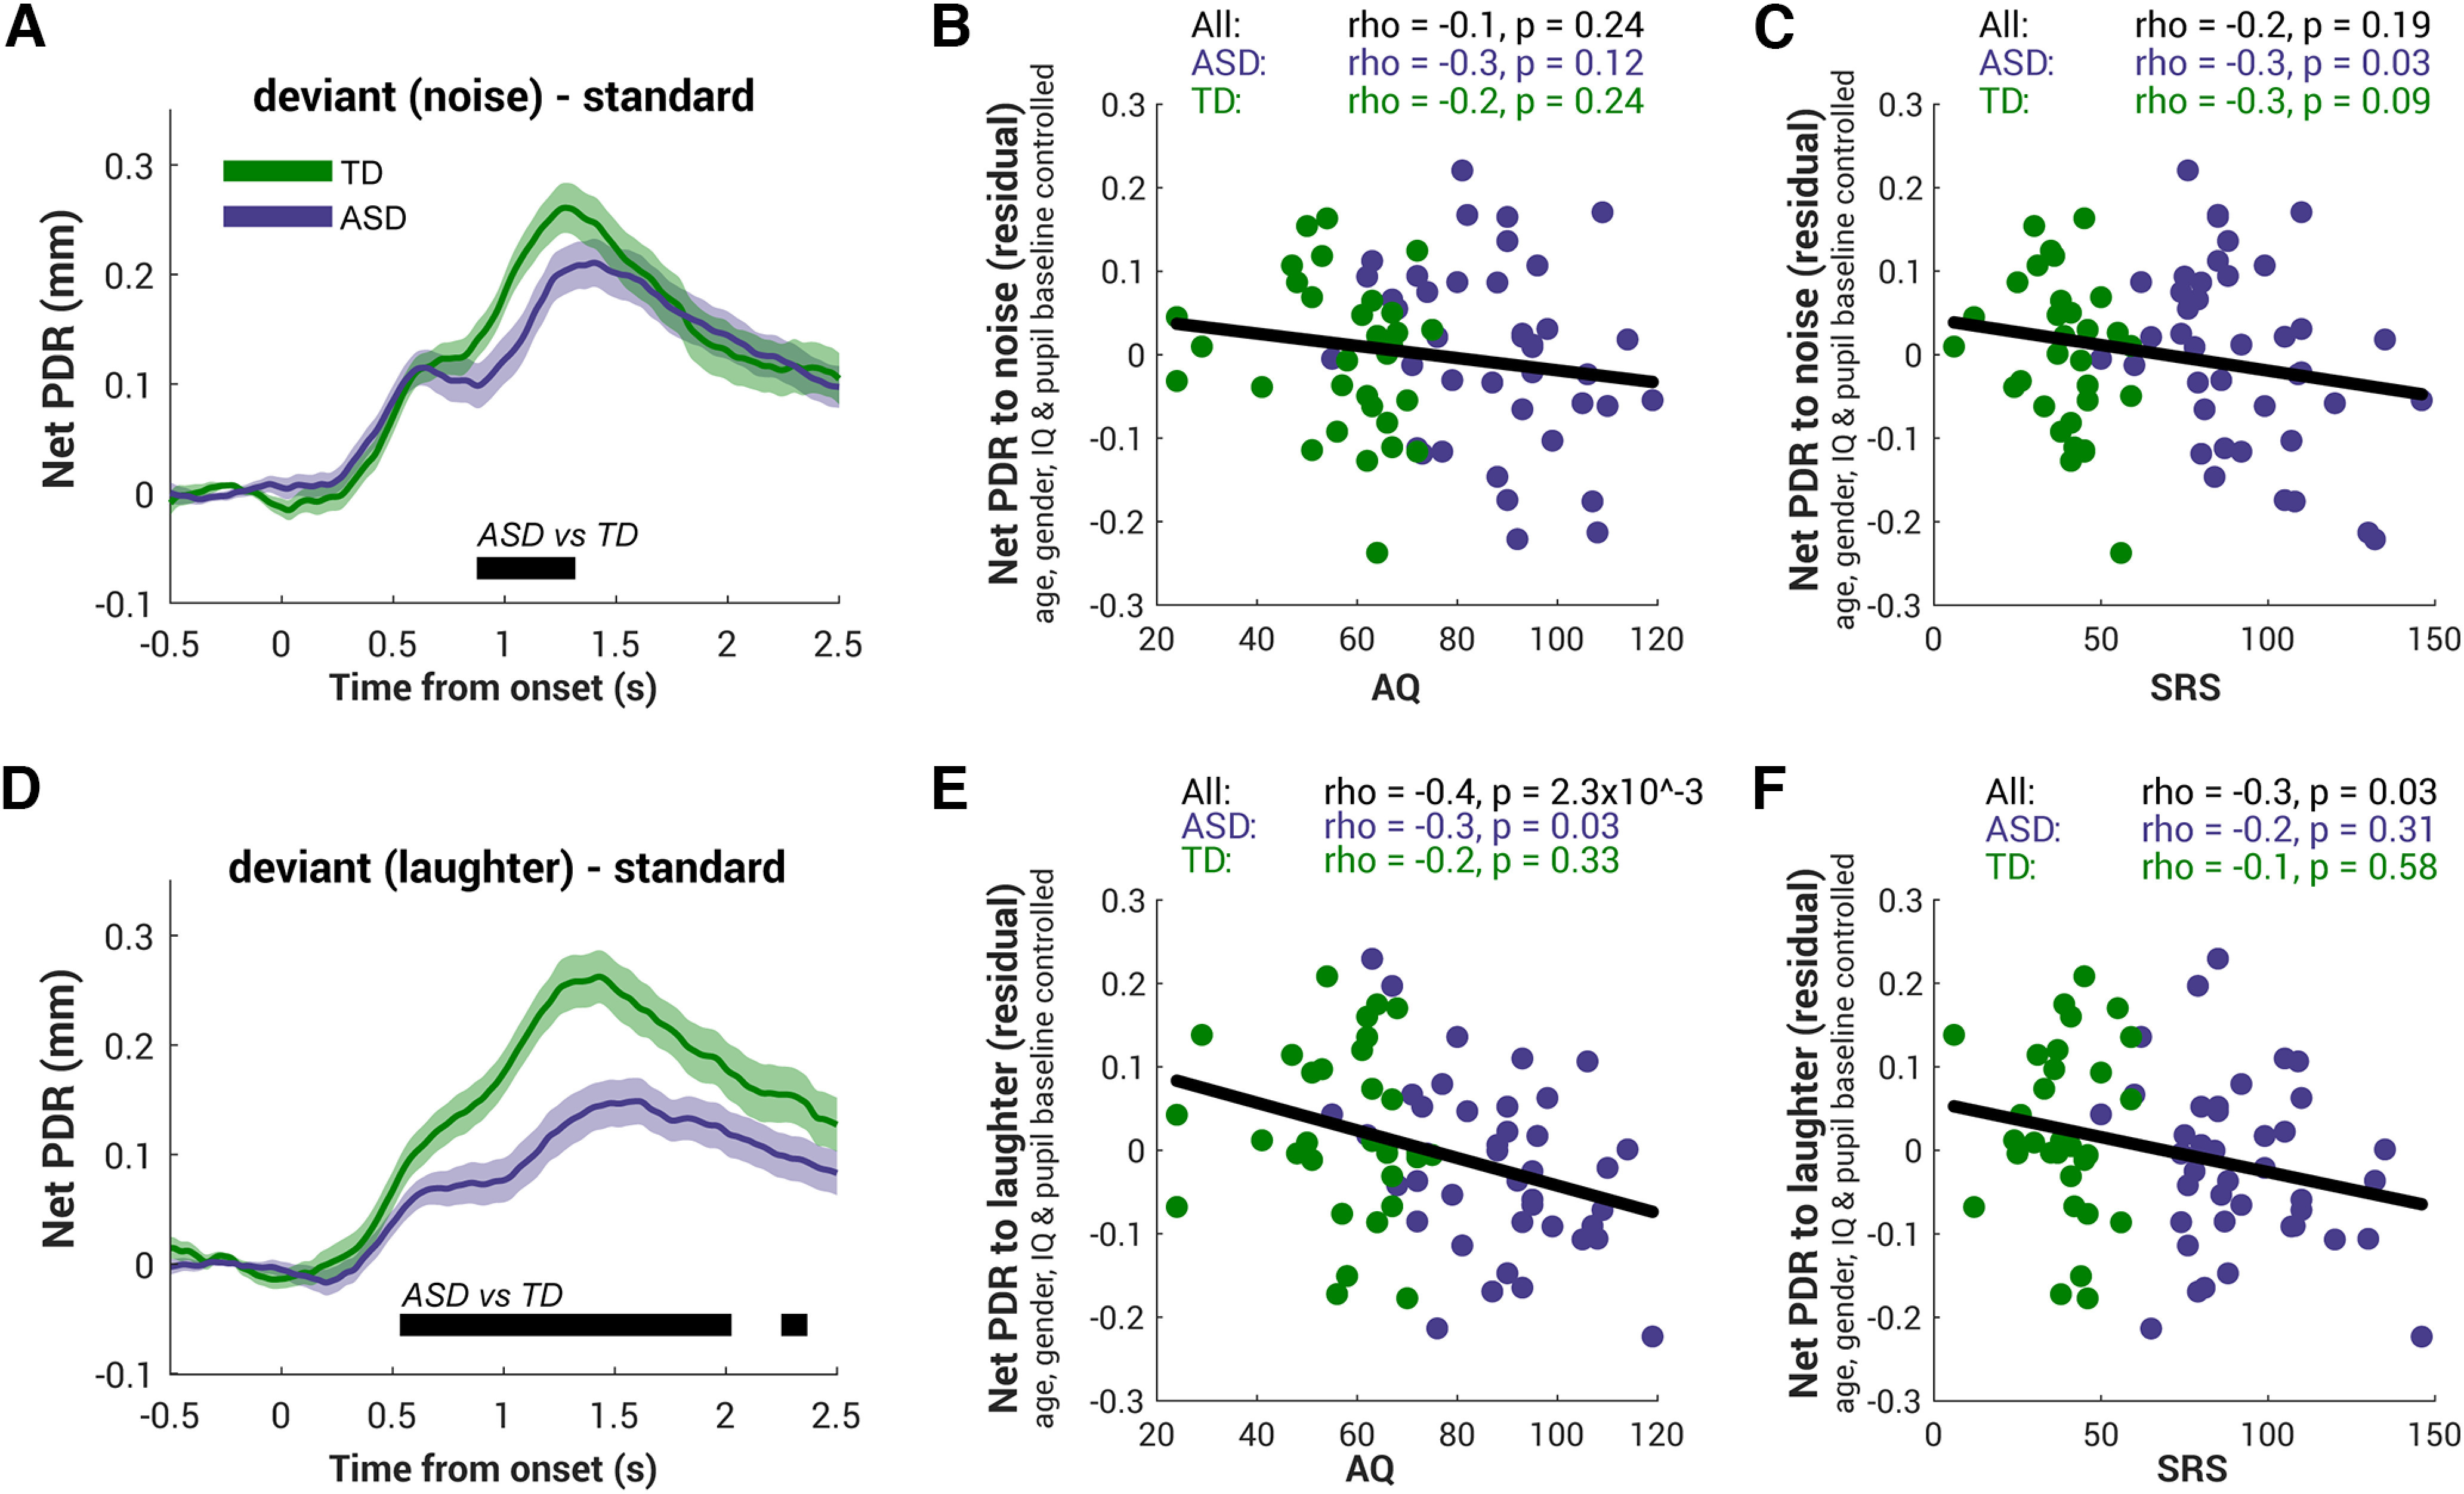
Figure 5.

Deviant containing social information evoked pupil dilation response associated with autistic trait. A, D, Comparison of the net PDR to the noise deviant (A) and the laughter deviant (D) in the ASD group (purple) and the TD group (green). The net PDR is computed for each participant by taking the difference between each deviant and the standard condition and averaged across participants. Bottom, The black horizontal line indicates the time interval where bootstrap resampling confirmed significant differences between groups. The shaded area shows ±1 SEM. B, C, For every subject a net PDR to noise was computed by averaging over the interval from 1 s to 2 s postonset. To rule out the effect of baseline on phasic PDR, we regressed out the effect of baseline, age, gender, and IQ from the net PDR to noise. The residual of the net PDR to noise does not correlate with the autistic traits, neither AQ (B) nor SRS (C). Each dot presents the individual subject's data from each group, green for TD and purple for ASD. The black line indicates the correlation among all individuals. Top, Spearman's correlation statistics are reported. E, F, Same analysis was applied to the net PDR to laughter with AQ (E) and SRS (F). The autistic traits negatively correlated with the size of the surprise response to laughter but not to the response to noise.
