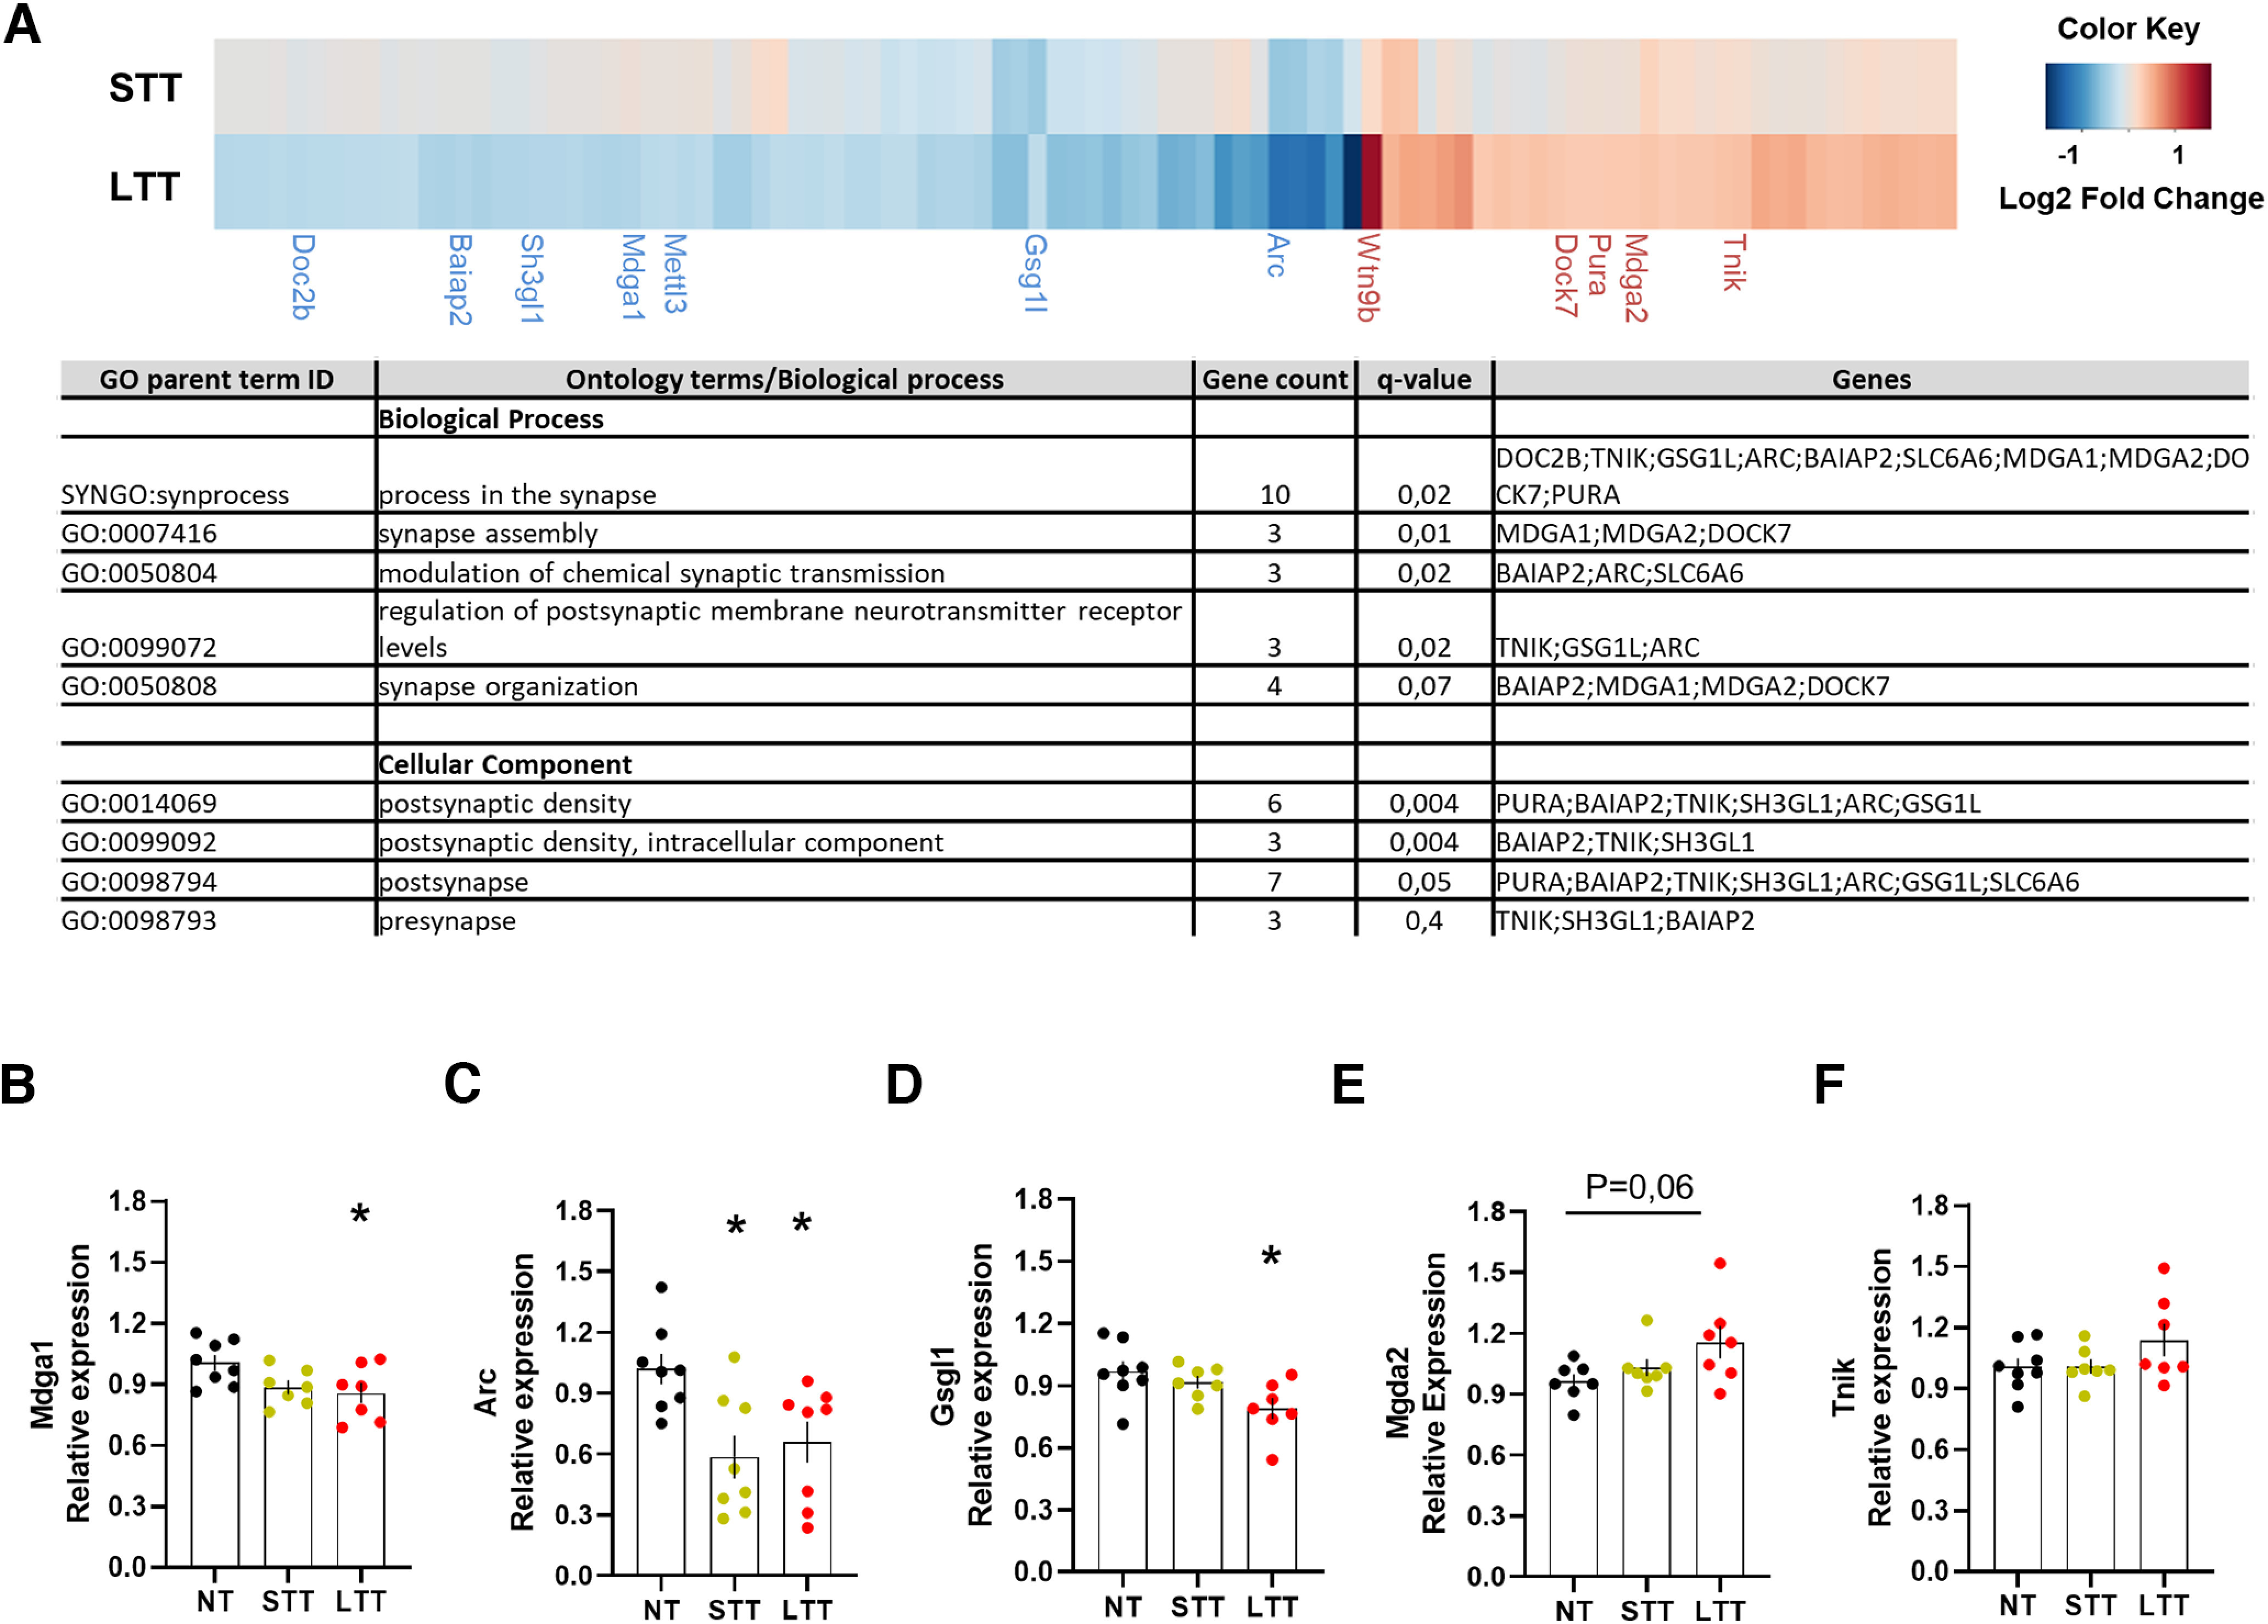
Figure 4.

Transcriptional changes associated with Egr1 promoter activity during the rotarod task training. A, Heatmap (upper panel) showing log2FC of DEGs with putative Egr1 binding sites in LTT and STT groups relative to the NT group. The results were considered statistically significant at Adj p-value < 0.05 and log2FC > 0.3 or < −0.3 in LTT. DEGs in STT are not statistically significant except for Gsgl1. Only synaptic genes are named. A table (lower panel) is also depicted to show the name of all the putative Egr1 binding sites in the LTT group. For full data, see Extended Data Table 4-1. Validation of RNA-seq data by quantitative real-time PCR (qRT-PCR) in NT, STT, and LTT groups of mice. Results from qRT-PCR performed on a few select genes: B, Mdga1; C, Arc; D, Gsgl1; E, Mdga2; F, Tnik, enriched in synapse processes. The error bars represent the range of the fold change values and data are analyzed by one-way ANOVA. A significant difference was detected between groups for Mdga1 (F(2,19) = 3762; p < 0.05), Arc (F(2,21) = 5957; p < 0.05), and Gsgl1 (F(2,19) = 4323; p < 0.05). Tukey's post hoc analysis indicated the significant differences (p < 0.05) compared with the NT group.
