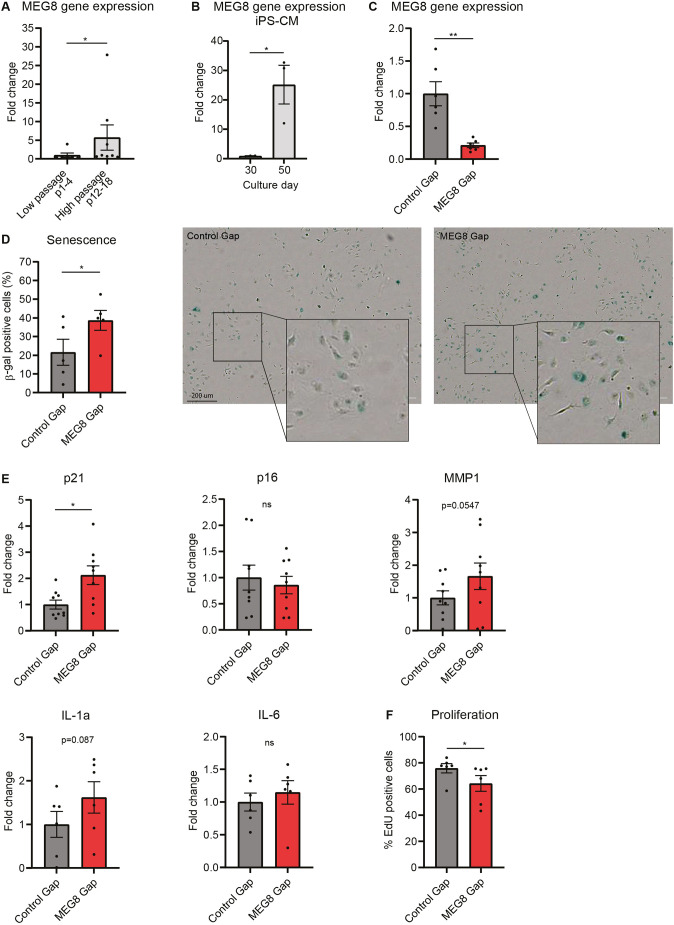
Fig. 1.
MEG8 expression is induced in high passage endothelial cells. (A) MEG8 mRNA levels were measured by RT-qPCR in HUVECs at low and high passage. Low passage (six samples) cells were between passage 1 and 4. High passage cells (eight samples) were between passage 12 and 18. Expression was normalized to RPLP0. Groups were compared using the Mann–Whitney test. (B) MEG8 mRNA levels were measured by RT-qPCR in iPSC-derived cardiomyocytes (iPS-CM). Cells cultured for 30 days were compared to 50 days in culture. Expression was normalized to RPLP0. 3 experiments were performed. Groups were compared using an unpaired two-tailed t-test. (C,D) HUVECs were transfected with MEG8 or control GapmeR (Gap) and (C) expression levels were measured 48 h after transfection by RT-qPCR. Expression is relative to RPLP0. Groups from six independent experiments were compared using a two-tailed paired t-test. (D) HUVECs were fixed 48 h after transfection stained using the senescence associated β-galactosidase staining kit. Cells were imaged 24 h after staining. Scale bar: 200 µm. Groups from five independent experiments were compared using a paired two-tailed t-test. (E) HUVECs were transfected with MEG8 or Control GapmeR and expression levels were measured 48 h after transfection by RT-qPCR. Expression is relative to RPLP0. Groups from 6–9 independent experiments were compared using a paired two-tailed t-test. (F) Proliferation was measured by EdU incorporation between 24–48 h after transfection. The percentage of proliferating cells is shown. Six experiments were performed. Groups were compared using a paired two-tailed t-test. Data are presented as mean±s.e.m. *P<0.05, **P<0.01, not significant (ns).

