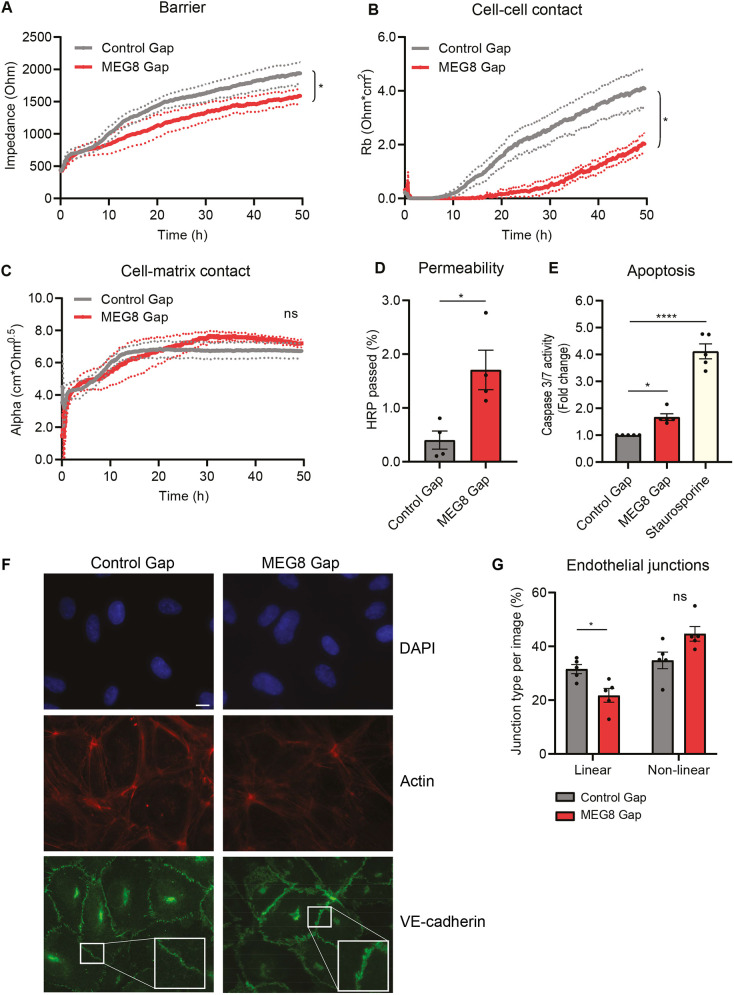
Fig. 2.
MEG8 is required for maintaining the EC barrier and cell–cell junctions. (A–C) HUVECs were seeded 24 h after transfection with MEG8 or control GapmeR (Gap) at a density of 100,000 cells per well in 8W10E ECIS plates. Impedance was measured continuously. By altering the frequency, the overall barrier (A), cell–cell contacts (B) and cell–matrix contacts (C) can be distinguished. The area under the curve was calculated for between 24 and 48 h. Groups were analyzed using a paired two-tailed t-test. Four independent experiments were performed. Continuous lines indicate the mean, dotted lines indicate s.e.m. (D) HUVECs were seeded on 3 µm filters 24 h after transfection. After 24 h, 5 µg/ml HRP was added to the top compartment. After 1 h, a sample was taken from the upper and lower compartments. HRP concentration was calculated by measuring absorbance. Data is presented as percentage of HRP in lower compartment. Four individual experiments were performed. Groups were analyzed using a paired two-tailed t-test. (E) HUVECs were seeded in a 96-well plate 45 h after transfection. Apoptosis was induced using 200 nm staurosporine. Caspase substrate was added and fluorescence was measured after 1 h. Fluorescence intensity was normalized to the control. Five individual experiments were performed. Groups were analyzed using one-way ANOVA with Dunnett test. (F,G) HUVECs were transfected, seeded on gelatin coated coverslips and grown to form junctions for 48 h. Cells were immunostained for VE-cadherin (green) and F-actin (red). Nuclei were stained with DAPI (blue). Scale bar: 10 µm. (G) Junction types were quantified from the images by overlaying a grid and scoring the most prevalent type junction in each square. Five independent experiments were performed, and two images per condition were scored in each experiment. Groups were compared using paired one-way ANOVA with Dunnett test. Data are presented as mean±s.e.m. *P<0.05, ****P<0.0001, not significant (ns).

