Fig. 3.
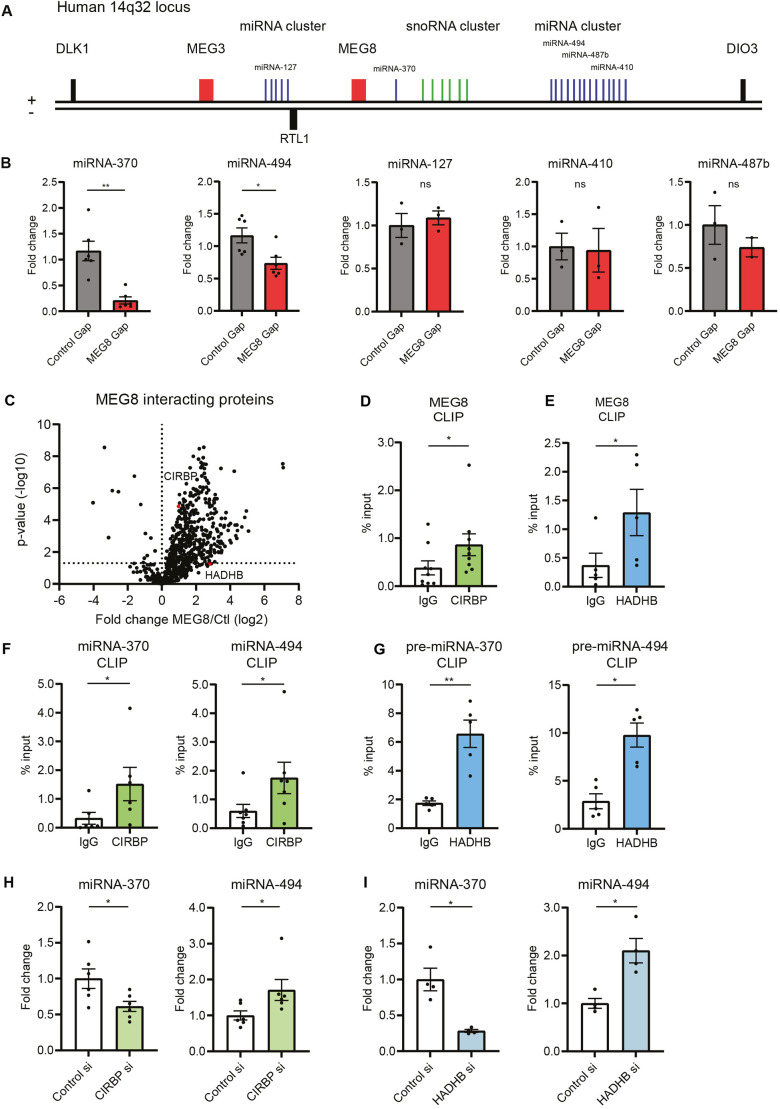
MEG8 interacts with CIRBP and HADHB, and regulates expression of miRNA-370 and -494. (A) Schematic overview of the human 14q32 locus. (B) HUVECs were transfected with MEG8 or control GapmeR (Gap) and mature miRNA expression levels were measured 48 h after transfection by RT-qPCR. Expression is relative to miRNA-191. Three to six individual experiments were performed. Groups were compared using a paired two-tailed t-test. (C) Elutions from MEG8-antisense purification were analyzed by mass spectrometry. A volcano plot is shown depicting proteins significantly enriched by an anti-MEG8 oligonucleotide compared to a non-targeting control. CIRBP and HADHB are highlighted in red. Six individual experiments were performed. (D,E) MEG8 binding to CIRBP (D) and HADHB (E) was analyzed in HUVECs by RT-qPCR following CLIP. Non-targeting IgG was used as a control. Enrichment was quantified relative to input. Five to nine individual experiments were performed. Data were analyzed by a paired two-tailed t-test. (F,G) miRNA and pre-miRNA binding to CIRBP (F) and HADHB (G) was analyzed in HUVECs by RT-qPCR following CLIP. Primers for pre-miRNA levels also detect pri-miRNA levels. Pri-miRNA primers are specific for pri-miRNA levels. Non-targeting IgG was used as a control. Enrichment was quantified relative to input. Five to seven individual experiments were performed. Data were analyzed by a paired two-tailed t-test. (H) HUVECs were transfected with CIRBP siRNA or control siRNA and expression levels were measured 48 h after transfection by RT-qPCR. Expression is relative to miRNA-191. Six individual experiments were performed. Groups were compared using a paired two-tailed t-test. (I) HUVECs were transfected with HADHB siRNA or control siRNA and expression levels were measured 48 h after transfection by RT-qPCR. Expression is relative to miRNA-191. Four individual experiments were performed. Groups were compared using a paired two-tailed t-test. Data are presented as mean±s.e.m. *P<0.05, **P<0.01, not significant (ns).

