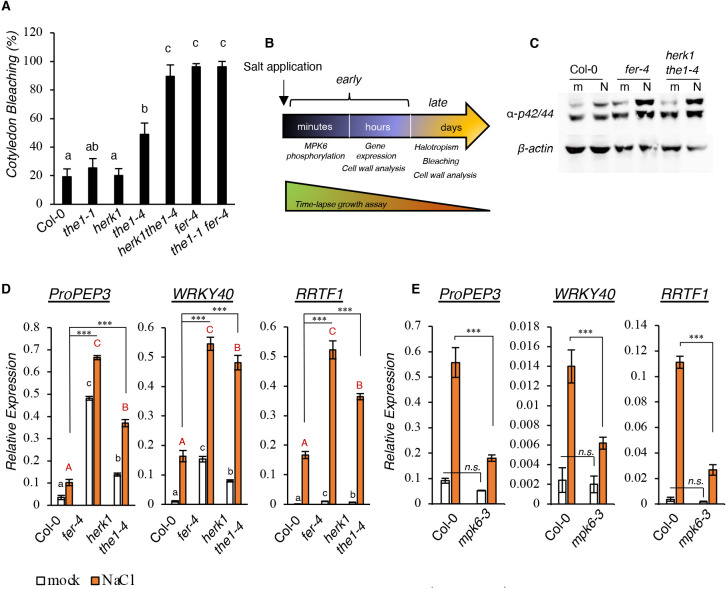
Fig. 1.
herk1 the1-4 and fer-4 mutant lines show enhanced early responses to salt stress. (A) Cotyledon bleaching analysis in 10-day-old seedlings germinated in 150 mM NaCl plates. Values, expressed as percentages, are the average of four independent experiments. Error bars represent s.e.m. One-way ANOVA and Tukey's HSD (α=0.05) were used to compare differences between genotypes within one treatment condition (salt). (B) Timeline of the treatments performed in this study. (C) Seven-day-old seedlings of the Col-0, fer-4 and herk1 the1-4 lines were treated for 15 min with water (mock, ‘m’) or 100 mM NaCl (‘N’). Phosphorylation of MPKs was detected by immunoblotting. Equal loading was checked using an anti-β-actin antibody. Similar results were obtained in three biological replicates. (D) Seedlings as in C were treated for 1 h and the expression of PROPEP3, WRKY40 and RRTF1 was determined by qRT-PCR and represented as the average of three biological replicates (n=3). Error bars indicate s.d. Statistical comparisons were made using one-way ANOVA and Tukey's HSD (α=0.05) considering the effect of the same treatment in different genotypes (black lowercase letters for mock, red uppercase letters for salt treatment). Comparisons between salt-treated wild-type seedlings and other genotypes were made by using multiple two-tailed unpaired t-tests coupled with Benjamini–Hochberg false discovery rate correction. ***P<0.001. (E) Seven-day-old seedlings of the Col-0 and mpk6-3 lines were treated as in D. Gene expression analysis was performed after 1 h water (mock) or 100 mM NaCl treatment. n=3. Error bars indicate s.d. Asterisks show statistical comparisons between NaCl-treated Col-0 or mpk6-3 according to multiple unpaired two-tailed t-tests and Benjamini–Hochberg correction. ***P<0.001; n.s., not significant.

