Fig. 6.
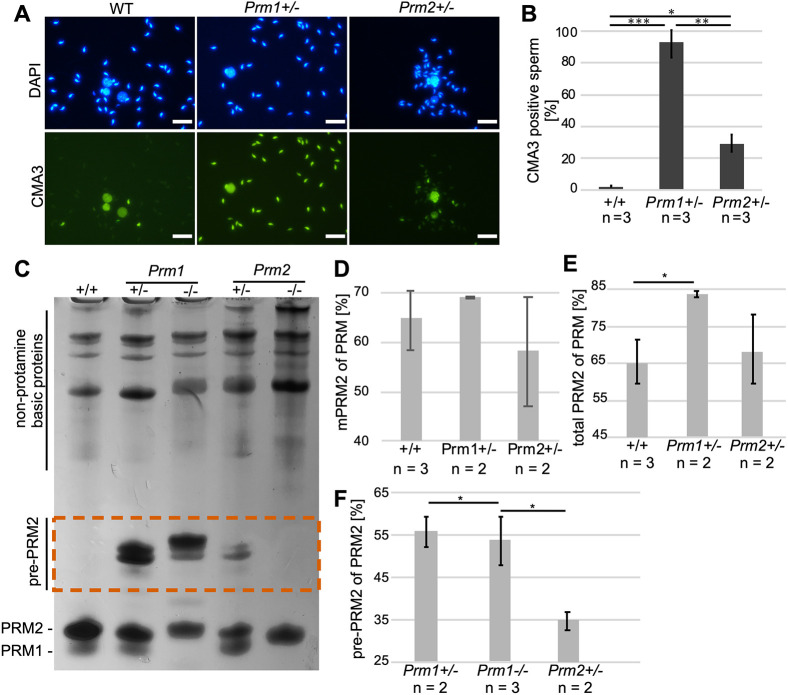
Sperm basic protein analysis in protamine-deficient sperm. (A) Representative images of CMA3 staining of Prm1+/+, Prm1+/− and Prm2+/− epididymal sperm heads taken at the same exposure time. DAPI was used as a counterstain. (B) Mean percentage of CMA3-positive sperm in Prm1+/−, Prm2+/− and WT males (n=3). A minimum of 400 sperm per male were analyzed. (C) Representative AU-PAGE of basic protein extractions from WT, Prm1+/−, Prm1−/−, Prm2+/− and Prm2−/− epididymal sperm. Non-protamine basic proteins were detected at the top of the AU-PAGE. PRM1 and PRM2 ran at the bottom of the gel. Pre-PRM2 ran higher than did mature PRM (dashed vermillion box). (D) Percentage of mPRM2 of PRM in basic protein extractions from WT, Prm1+/− and Prm2+/− epididymal sperm. (E) Percentage of total PRM2 (including pre-PRM2) of PRM in basic protein extractions from WT, Prm1+/− and Prm2+/− epididymal sperm. (F) Percentage of pre-PRM2 of PRM2 in basic protein extractions from Prm1+/−, Prm1−/− and Prm2+/− epididymal sperm. Data are mean±s.d. and were analyzed using a two-tailed, unpaired Student's t-test (*P<0.05; **P<0.005; ***P<0.001). Scale bars: 20 µm.

