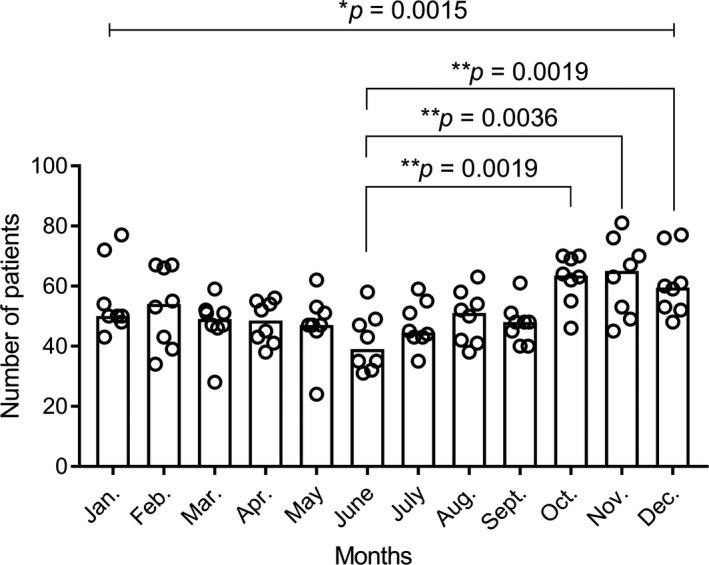
FIGURE 2.

Number of admissions of patients with adhesive small bowel obstruction in each month of the year. Each column has eight circles, which indicate the number of admissions of patients in each month. Data are presented as the median and scatter plot. P values with an asterisk were determined by the Kruskal‐Wallis test, and P < .05 was considered statistically significant. P values with a double asterisk were determined by two‐tailed Mann‐Whitney tests with Bonferroni corrections, and P < .0042 was considered statistically significant
