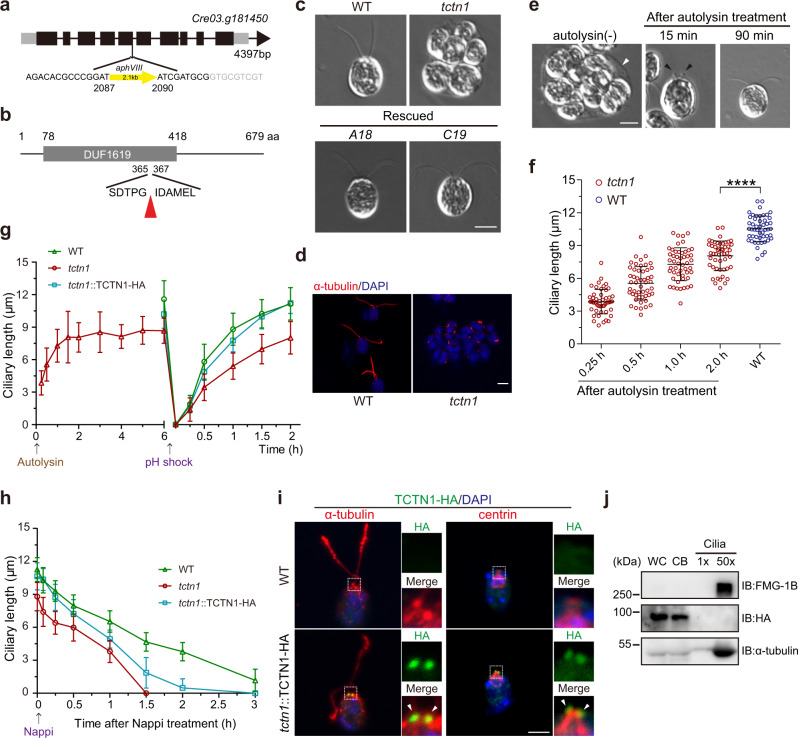
Fig. 1. Characterization of the C. reinhardtii tctn1 mutant.
a Diagram of the gene structure of TCTN1 (Cre03.g181450) with the aphVIII DNA insertional site. b Diagram of the domain structure of the TCTN1 protein. The TCTN1 protein (679 aa) contains the DUF1619 domain (78–418 aa) with unknown function. The red arrowhead marks the insertional site. c DIC images showing the ciliary phenotypes of WT, mutant, and rescued cells (A18, C19). Scale bar, 5 μm. d Immunostaining images depicting the very short cilium within the palmelloid of tctn1. The red signals (by anti-α-tubulin antibody) mark the cilia and the blue signals (by DAPI) mark the nucleus. Scale bar, 5 μm. e DIC images depicting the ciliary phenotype of tctn1 after treatment with autolysin. The mother cell walls are indicated by white arrowhead and the ciliary bugles are indicated by black arrowheads. Scale bar, 5 μm. f Scatter plot showing the elongation of cilia in e. Statistical significance was determined with an unpaired t test. ****P < 0.0001 by two tailed. g tctn1 exhibited shorter cilia after hatching with autolysin and slower kinetics of ciliary assembly. The arrow indicates the time point of autolysin or pH shock treatment. h tctn1 exhibited faster kinetics of ciliary disassembly. The arrow indicates the time point of Nappi treatment to induce ciliary shortening. i Immunostaining showing the localization of TCTN1 in the TZ. Cells were immunostained with HA (green) and α-tubulin (red, left) or centrin (red, right) antibodies. The nucleus was stained with DAPI (blue). The arrowheads indicate the TZ. The dotted boxes indicate the regions of higher magnification views. Scale bar, 5 μm. j Immunoblot analysis of the localization of TCTN1-HA in the rescued cell line. 1× (cilia) represents an equal proportion of cilia to that of the cell body (two cilia per cell body). 50× (cilia) represents equal cilia and cell body proteins. WC whole cell, CB cell body. Ciliary lengths are shown as the mean ± SD of 50 cilia. Source data are provided as a Source Data file.

