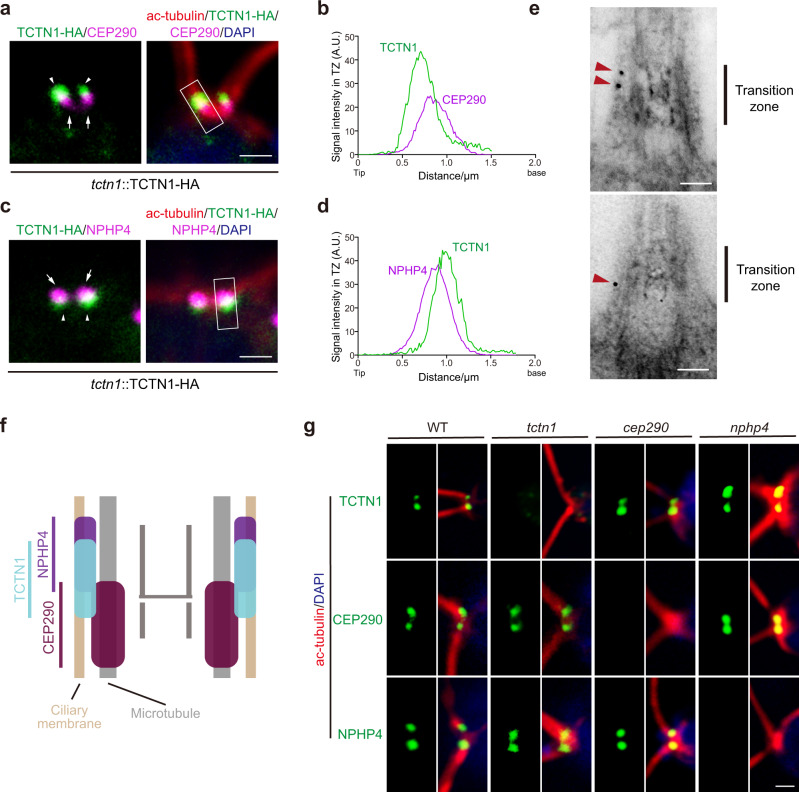
Fig. 3. TCTN1 is located between CEP290 and NPHP4 independently.
a–d Immunostaining images and graphs depicting the colocalization of TCTN1 and NPHP4/CEP290. The rescued cells expressing TCTN1-HA were immunostained with anti-acetylated α-tubulin (ac-tubulin, red), anti-HA (green), and anti-CEP290 (a, magenta) or anti-NPHP4 (c, magenta) antibodies. The nucleus was stained with DAPI (blue). The arrowheads and arrows indicate the localization of TCTN1-HA and CEP290 (a)/NPHP4 (c), respectively. The scan plots of the rectangular gray value in the merged image show the relative intensities (arbitrary units, A.U.) of the indicated proteins in the TZ. Scale bar, 1 μm. e TEM imaging showing the longitudinal sections of TCTN1–HA transition zones labeled with anti-HA (10-nm gold, red arrowheads). Scale bar, 0.1 μm. f Schematic of the localization of TCTN1, CEP290, and NPHP4 at the TZ. g Immunostaining depicting the TZ localization of TCTN1, NPHP4, and CEP290 in WT, tctn1, cep290, and nphp4 cells. Cells as indicated were immunostained with anti-acetylated α-tubulin (ac-tubulin, red), anti-TCTN1/CEP290/NPHP4 (green) antibodies. The nucleus was stained with DAPI (blue). Scale bar, 1 μm.

