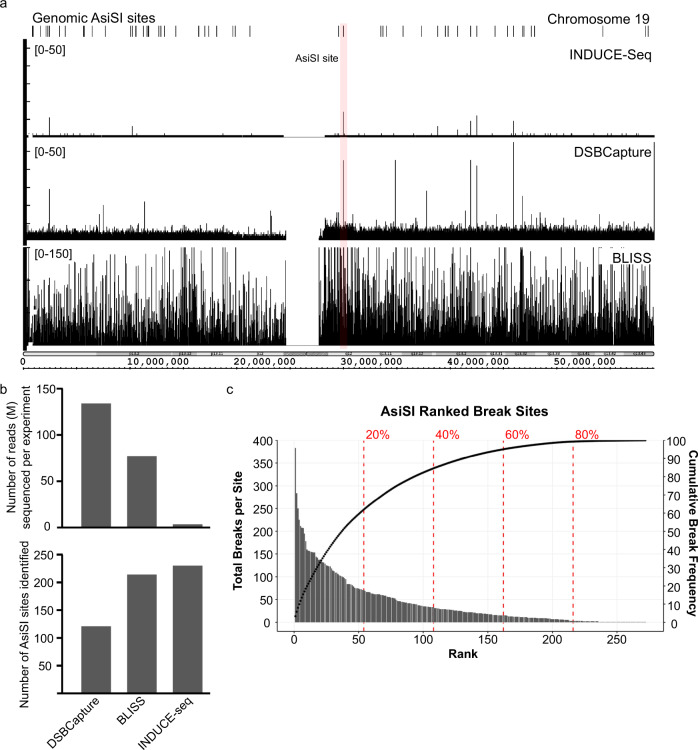
Fig. 3. INDUCE-seq reveals the characteristics of AsiSI site cleavage in live DIvA cells.
a Genome browser view (IGB) comparing raw sequencing output of three different DSB capture methods used to detect induced breaks in live DIvA cells. The top panel indicates AsiSI recognition sequences present on chromosome 19. The second panel depicts the raw INDUCE-seq readout. The bottom two panels show the raw output of DSBCapture and BLISS. b Comparison between INDUCE-seq, DSBCapture and BLISS in detecting AsiSI-induced breaks in live DIvA cells. The number of reads sequenced (b, top panel) is compared to the number of AsiSI sites identified in each experiment (b, bottom panel). c AsiSI sites detected by INDUCE-seq ranked by break number. Total number of breaks were plotted at each of the 278 AsiSI restriction sites (primary y-axis). The cumulative break frequency at AsiSI sites was calculated and plotted as a percentage on the secondary y-axis. Source data are provided as a Source Data file.

