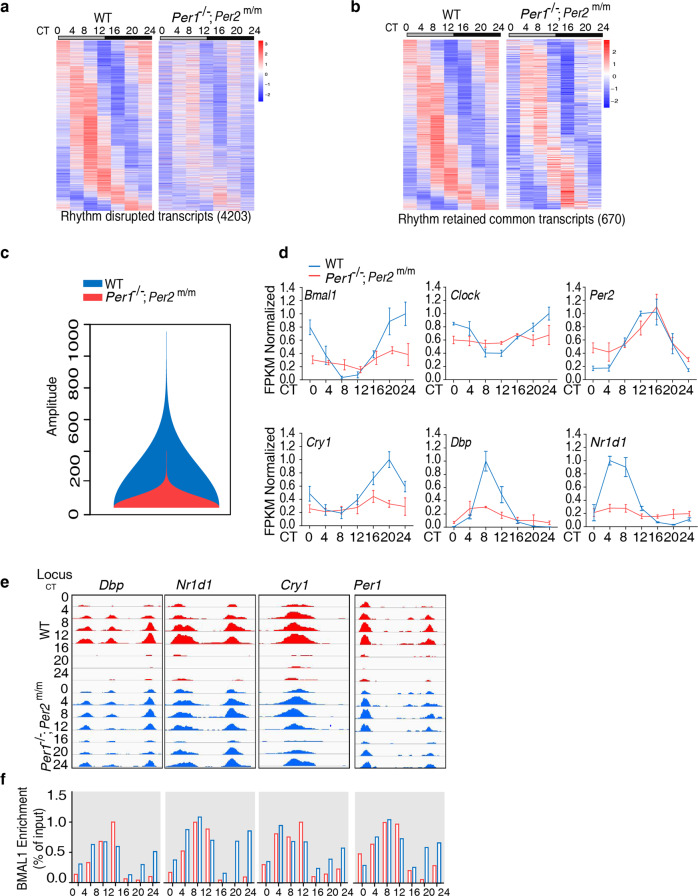
Fig. 6. Disruption of CK1δ-PER interaction impairs robust rhythmic gene expression and removal of CLOCK-BMAL1 complex from E-boxes during subjective night.
a Heatmap of transcript levels of the identified 4203 rhythmic genes in the WT and the corresponding genes in the Per1−/−; Per2m/m mice at the indicated circadian time points. RNA-seq was performed using liver tissue collected at the indicated time points (n = 3 per time point). The color bar indicates the scale used to show the expression levels of transcripts normalized to Z-scores. Rhythmic expressed genes were identified by meta2d function in MetaCycle with adjusted p < 0.05, period 24 h. b Heatmap of common 670 rhythmic genes in the WT and Per1−/−; Per2m/m mice (MetaCycle package, P < 0.05). The color bar indicates the scale used to show the expression of transcripts across seven time points, with expression normalized to Z-scores. c Violin plot comparing the amplitudes of common rhythmic genes in the WT and Per1−/−; Per2m/m mice. The relative amplitudes of the 670 common rhythmic genes in the WT and Per1−/−; Per2m/m mice were obtained from MetaCycle package and the violin plot was generated using R package vioplot (https://cran.r-project.org/web/packages/vioplot/vioplot.pdf). d Rhythmic transcript levels of selected clock genes in the WT and Per1−/−; Per2m/m mice determined by RNA-seq. Data are represented as mean ± SD, n = 3. e BMAL1 ChIP-Seq results at the indicated time points and loci in the WT and Per1−/−; Per2m/m mice. UCSC genome browser views of BMAL1 occupancy are shown. Each track represents the normalized ChIP-seq read coverage (wiggle plot) across regulatory regions of the indicated genes. f Quantification of relative BMAL1 levels at the indicated E-box loci at the different time points.

