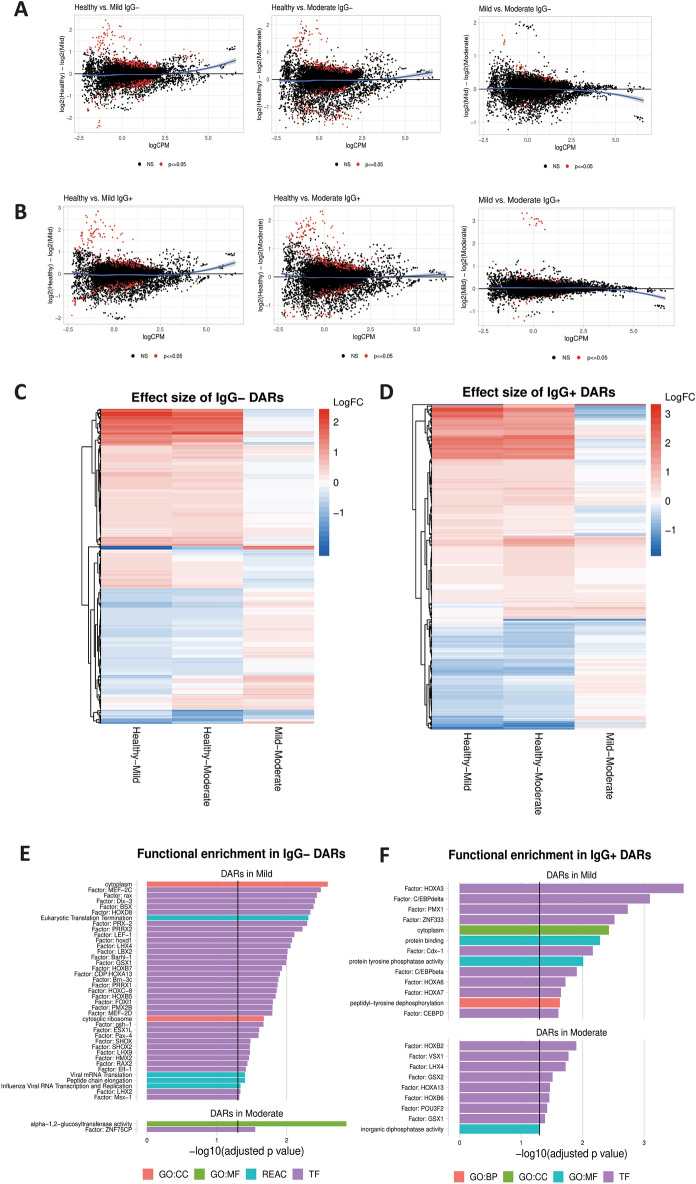
Figure 2.
Remodeling of the chromatin landscape identifies gene regulatory markers associated with symptom severity. (A) Differential chromatin accessibility, comparing healthy controls to mild symptom IgG− subjects (left) and healthy to moderate symptom IgG− subjects (center), and IgG− mild to moderate symptoms (right). Regions that are significantly different in each comparison at p ≤ 0.05 are red; regions not significantly different are black. A loess curve fit to the results is plotted in blue. (B) Differential chromatin accessibility, comparing healthy controls to mild symptom IgG+ subjects (left), healthy controls to moderate symptom IgG+ subjects (center), and mild to moderate IgG+ subjects (right). A loess curve fit to the results is plotted in blue. (C,D) Heat map depiction of differentially accessible regions (DARs) that compares healthy to mild symptoms (left column), healthy to moderate symptoms (center column) and mild to moderate symptoms (right column) in IgG− subjects (C) and in IgG+ (D). (E,F) Functional enrichment analysis of DARs in the TRANSFAC database (purple), the REACTOME database (red), and gene ontologies (GO) in categories of biological processes (BP, orange), cellular component (CC, blue), and molecular function (MF, green). DARs identified comparing healthy to mild symptoms (top) or healthy compared to moderate symptoms (bottom) are shown for IgG− (E) and IgG+ (F) subjects.

