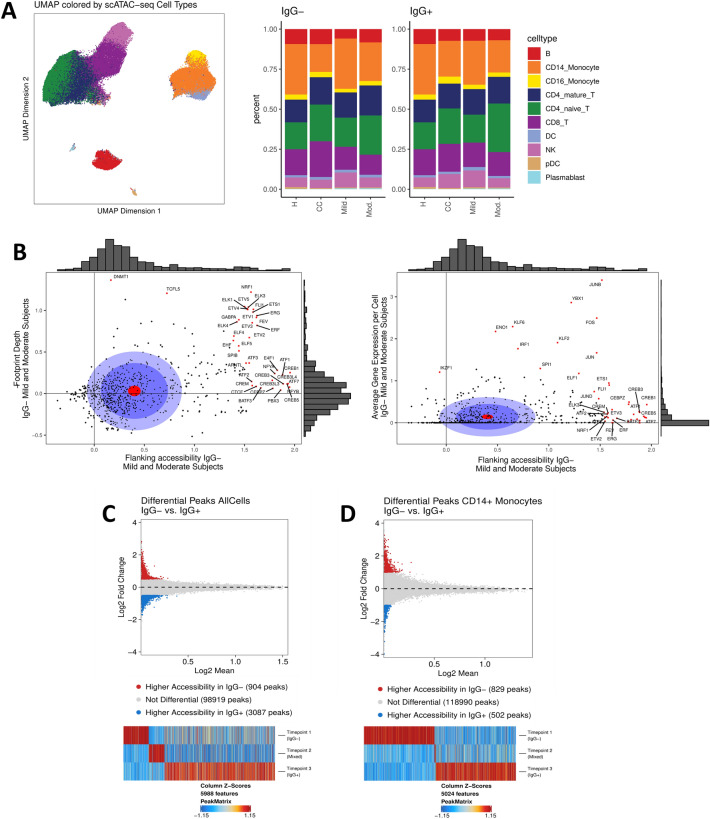
Figure 3.
Epigenetic signatures in cells collected from COVID-19 subjects evolve with disease progression. (A) Uniform manifold approximation and projection (UMAP) plot of single-cell ATAC-seq data generated from healthy controls, uninfected close contacts, and COVID-19 subjects with mild or moderate symptoms (left). Relative abundance of cell types represented in the scATAC-seq data are plotted for each group at IgG− and IgG+ timepoints for COVID-19 subjects and collection day 0 and 14 for close contacts (right). (B) Transcription factor motif accessibility and binding activity measured by footprint depth (left) or average per-cell gene expression (right) in COVID-19 subjects with mild or moderate symptoms. Distribution of accessibility and gene expression are plotted as histograms along the axes (gray). The red circle is the average of all points; the dark blue circle is 50% of all data; the light blue circle is 75% of all data. Motifs with the top 5% change in flanking accessibility are plotted in red. (C) Differentially accessible chromatin between IgG− and IgG+ timepoints in all cells and (D) CD14+ monocytes. Differentially accessible chromatin observed across the IgG−, mixed and IgG+ timepoints in COVID-19 subjects is shown where significance is defined as p ≤ 0.05 and absolute LFC ≥ 0.5 (top); Changes in differentially accessible chromatin are shown across time (bottom).

