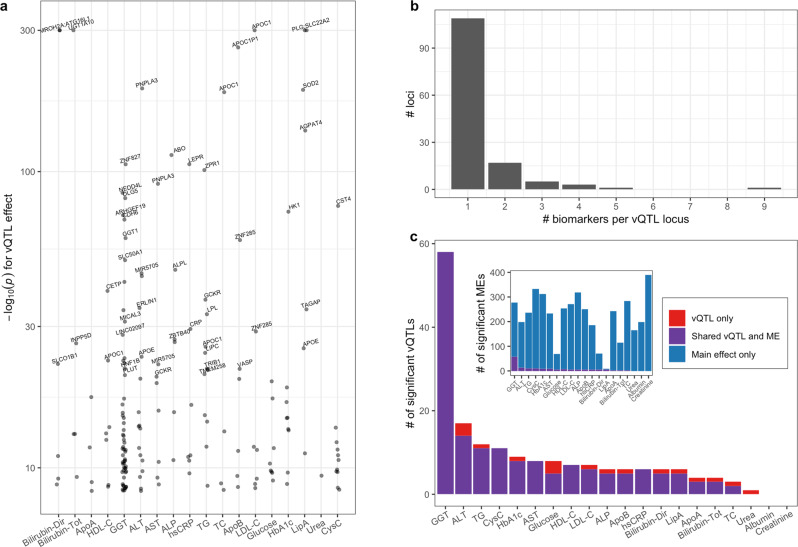
Fig. 2. vQTLs identified across 20 cardiometabolic serum biomarkers.
a −log10PvQTL from Levene’s test is shown for all significant index variants for each biomarker. Labels correspond to the closest gene (shown for variants with PvQTL < 10−20), highlighting some known GWAS loci. P values are truncated at 10−300 for visualization purposes. b Histogram displaying the number of biomarker associations for each vQTL locus. c The number of significant vQTL loci is shown for each biomarker (inset: analogous plot for main effects). Colors denote three categories: vQTL loci not shared with an ME locus (red), vQTL loci shared with an ME locus (purple), and ME loci not shared with a vQTL locus (blue).

