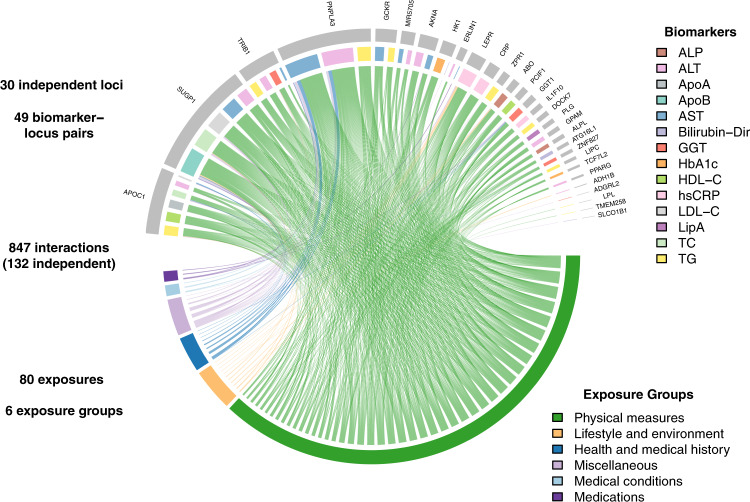
Fig. 3. Chord diagram displays GEI links between vQTL-biomarker pairs (top of circle) and exposures (bottom of circle).
Lines correspond to interactions that are Bonferroni significant (p < 2.38 × 10⁻⁷) for the associated variant, biomarker, and exposure based on two-sided p-values from linear regression. vQTL-biomarker pairs are colored according to biomarker and labeled with the nearest gene. Exposures are colored according to exposure categories.

