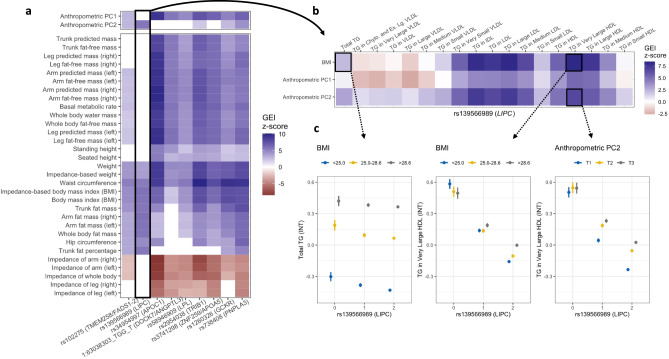
Fig. 4. Exploration of anthropometric interactions influencing triglycerides.
a Heatmap shows interaction z-scores from standard linear regression models between nine genetic variants (x axis) and 33 anthropometric exposures (y axis). Colored panels pass a nominal significance threshold (p < 0.05). Variants are annotated with the closest gene, as well as a second likely causal gene based on manual annotation where appropriate. b Heatmap shows interaction z scores for a single variant (rs139566989 in LIPC), with varying TG lipid subfraction outcomes from nuclear magnetic resonance (x axis) and three representative anthropometric exposures (y axis). c Three stratified plots showing means and 95% confidence intervals for inverse-normal transformed total TG or TG in very large HDL after stratification by rs139566989 and tertiles of the relevant exposure (labeled at the top of each plot; n = 90,644 total participants).

