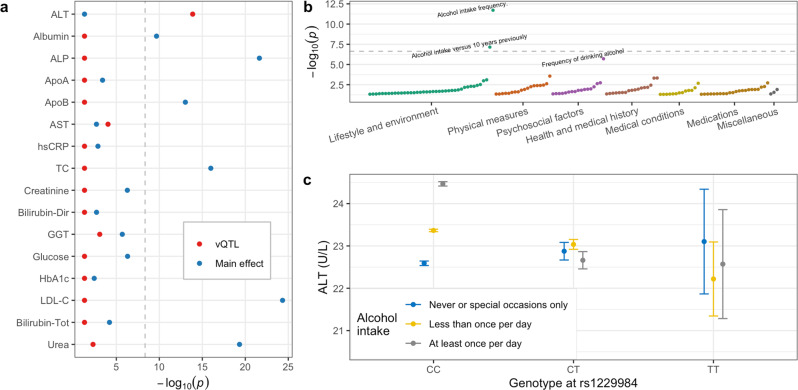
Fig. 5. vQTL and GEI relationships for ADH1B, alcohol, and ALT.
a vQTL (red) and ME (blue) significance for rs1229984 is shown for each biomarker, based on Levene’s test and linear regression, respectively. The dashed line represents the study-wide Bonferroni vQTL significance threshold. Biomarkers with neither vQTL nor ME having p < 0.01 are not shown. b EWIS results for rs1229984 impacting ALT are shown, with GEI significance plotted (y axis) for each exposure having p < 0.05 (x axis). c Means and standard errors for ALT (n = 341,815 [CC], 17,539 [CT], 318 [TT] participants) are plotted as a function of genotype at rs1229984 (x axis) and self-reported alcohol intake (colors).

