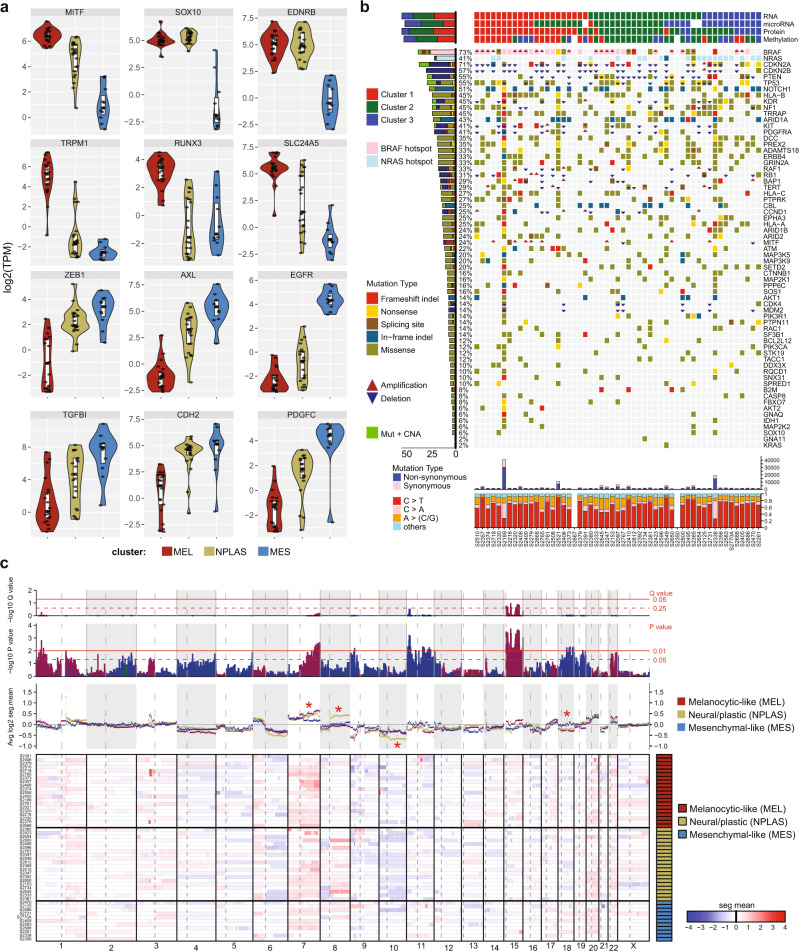
Fig. 3. Relationships of mutations and DNA methylation to MEL or MES gene expression.
a Violin plots comparing expression of selected MEL and MES genes between cNMF-derived clusters in the early passage melanoma MDACC cell lines (n = 53) reveal several distinct types of relationship between gene expression and sample cluster type. These include: graded relationships (gradual transition in expression level across the MCS, e.g. MITF, AXL, SLC24A5); switch (non-overlapping high/low) relationships (e.g. SOX10, EDNRB); or genes almost exclusively expressed in one MCS only (e.g EGFR). Boxes indicate the median (thick bar), first and third quartiles (lower and upper bounds of the box, respectively). Violins (kernel probability density) extend to the lowest and highest data value. All individual data points are shown. b Oncomap of genomic alterations affecting a panel of genes commonly mutated or copy number altered in melanoma, with cNMF-derived MCS clusters indicated in the tracks above based on RNA expression, miR expression, protein expression (measured by RPPA), or DNA methylation pattern. Summary data of mutation type (synonymous or non-synonymous), and nucleotide changes are indicated below for each sample. The histogram at the left indicates the cumulative frequency of genomic events affecting each gene. c Genome-wide CNA indicated by heatmap and segmentation map, comparing results from MDACC cell lines grouped by cNMF-defined MCS. Source data are provided as a Source Data file.

