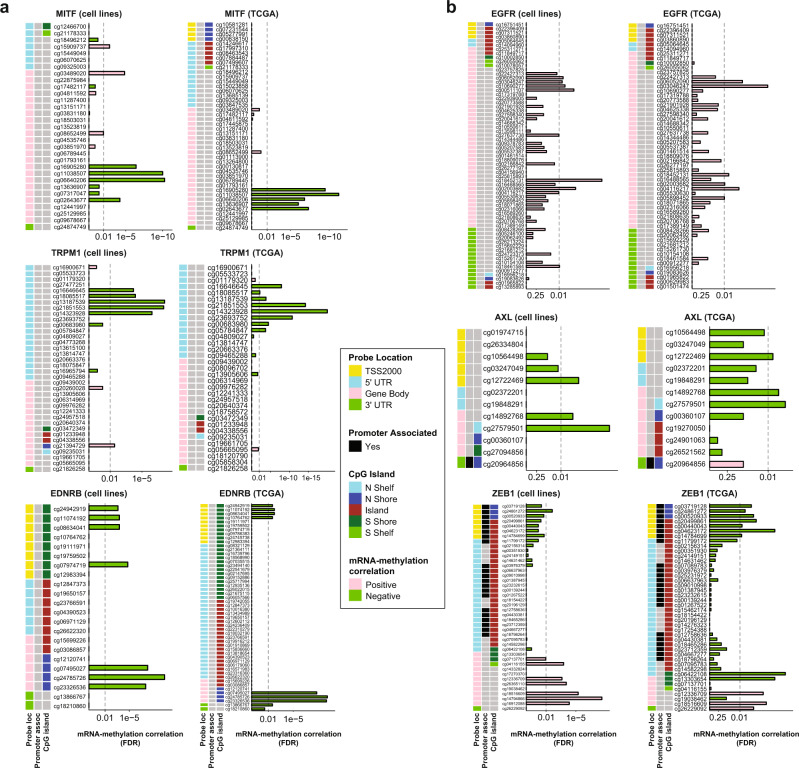
Fig. 4. DNA methylation demonstrates site- and gene-specific associations with MEL and MES gene expression.
a, b Overview of statistically significant DNA methylation events for (a) 3 MEL genes and (b) 3 MES genes contrasting the observed exclusively negative (green bars), exclusively positive (pink bars), and mixed patterns of correlation between individual methylation probes and expression of the indicated gene. FDR-corrected two-sided Spearman correlation p values are shown. For each gene, DNA methylation in MDACC cell lines is shown at the left, and in TCGA melanoma samples at the right; note that due to processing pipelines used, the available datasets report overlapping but non-identical probesets per gene.

