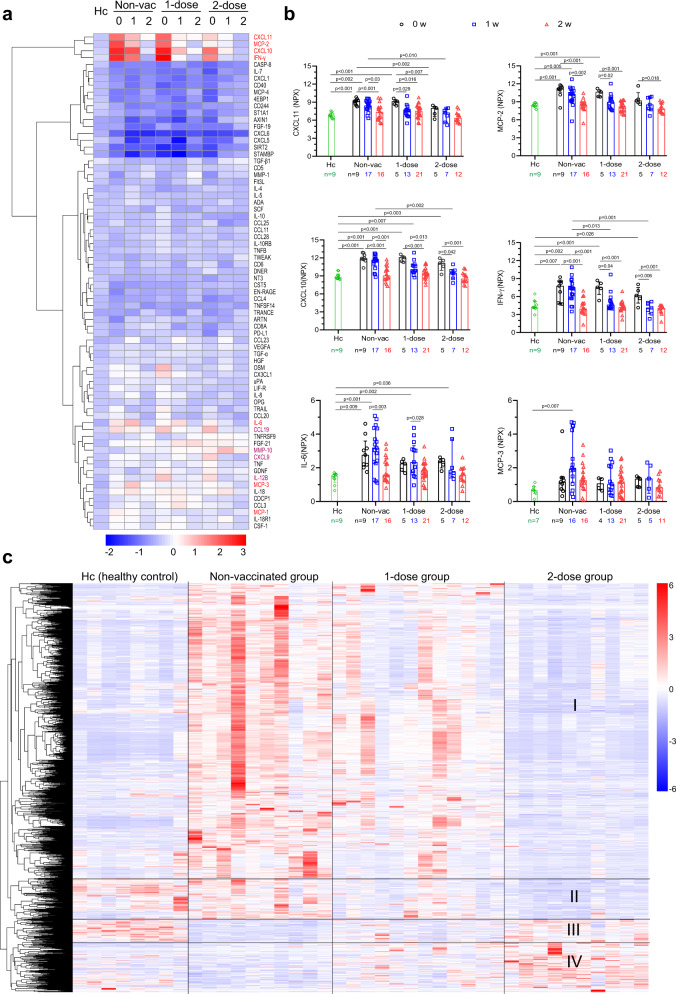
Fig. 4. Changes in serum inflammatory cytokines and gene expression in PBMCs.
a Serum cytokine levels at weeks 0, 1, and 2. A total of 72 (of 92) cytokines measured by O-link technology were included. b Kinetics of CXCL-10, CXCL11, IFN-gamma, MCP-2, IL-6, and MCP-3. NPX, normalized protein expression. Two-talied p values (Tukey’s multiple comparisons test) are indicated, and the data are the median (IQR). Comparisons without significant difference (p > 0.05) are not shown. c Transcriptome changes in PBMCs at week 1 (day 6–10). Heatmap showing counts per million (CPM) values of four groups based on differentially expressed genes (FDR < 0.05, |log2FC| > 1) in the nonvaccinated group versus the 2-dose group. There were 232 upregulated genes, and 1072 downregulated genes. Expression has been scaled by row (or gene). Hc healthy control. Non-Vac nonvaccinated group. 1-dose 1-dose vaccine group. 2-dose 2-dose vaccine group. 0 w week 0, days 0–5. 1 w week 1, days 6–10. 2 w week 2, days 11–16. Source data are provided as a Source Data file.

