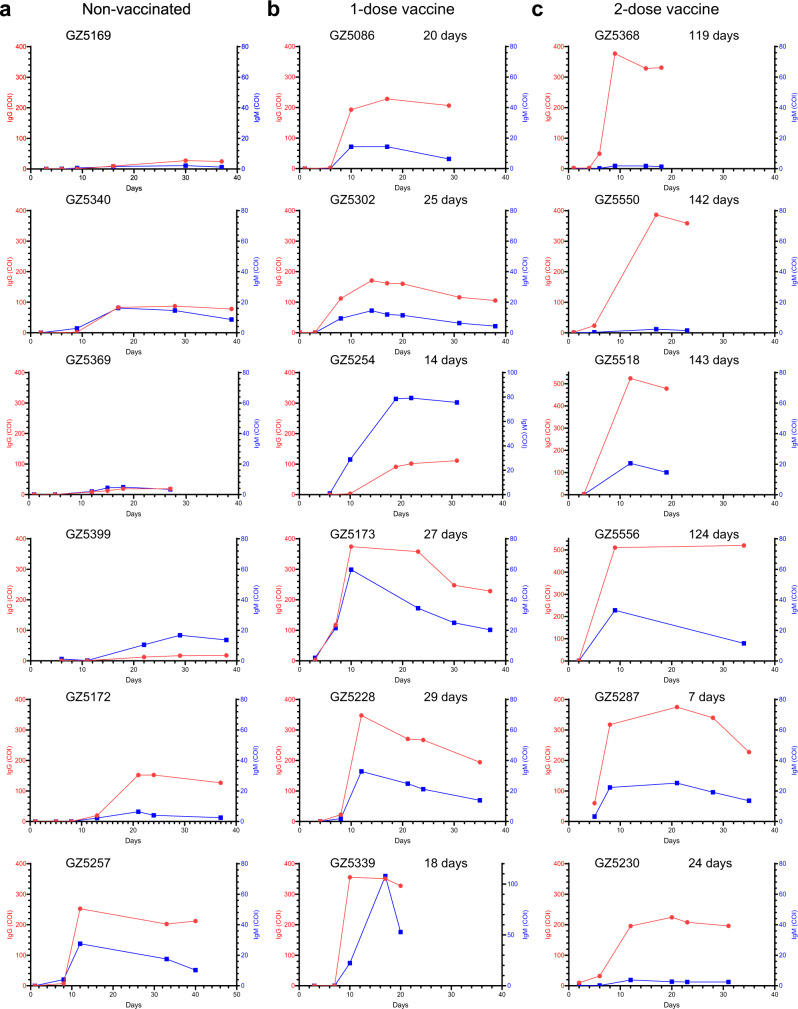
Fig. 5. Features of anti-RBD-specific IgM and IgG.
a–c Anti-RBD-specific IgM and IgG from representative individuals in the nonvaccinated group (a), in 1-dose vaccine group (b), and in the 2-dose vaccine group (c). Patient number and interval from last vaccination to infection are indicated on top of each individual. The red circle represents RBD-IgG. The blue square represents RBD-IgM. COI cut-off index. Source data are provided as a Source Data file.

