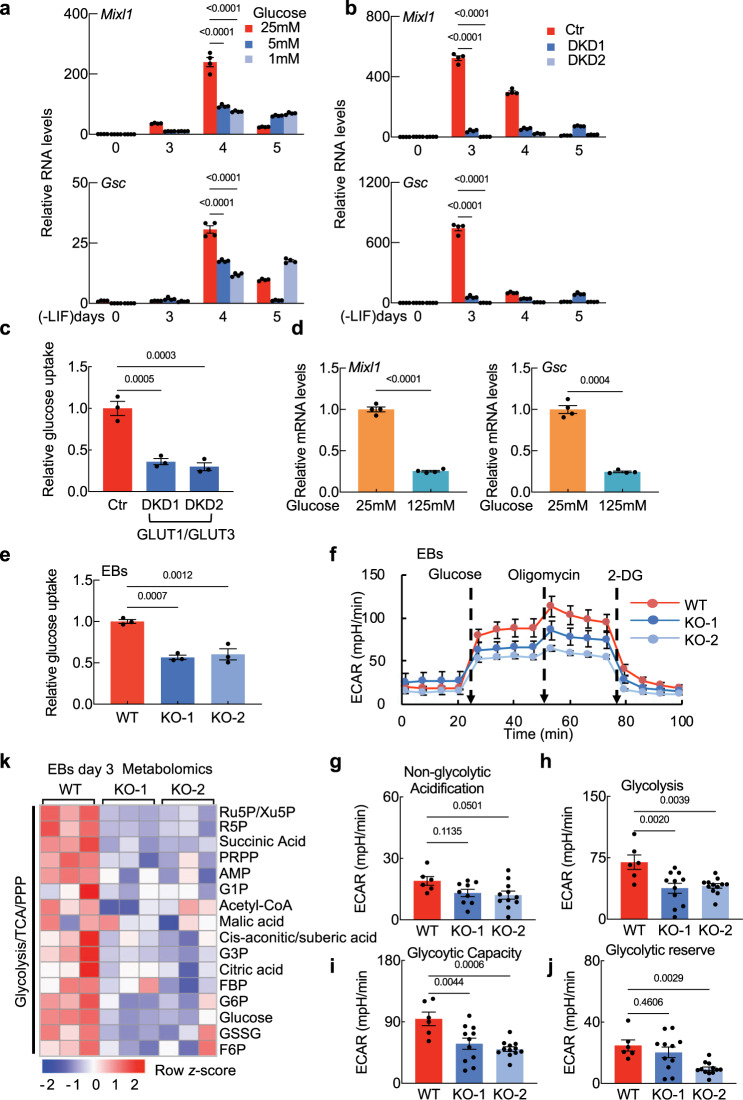
Fig. 6. NEMEP facilitates glucose uptake during mesendoderm differentiation.
a mESCs cultures were induced for EBs formation for the indicated lengths of time. EBs at day 2 were cultured in medium containing 25 mM, 5 mM, or 1 mM glucose. Expression of the indicated genes was analyzed by qPCR (n = 4 biological independent samples). b qPCR analysis of indicated genes at the times in EBs induced from WT or Glut1 and Glut3 double knock-down (DKD) cells by shRNA (n = 4 biological independent samples). c Glucose uptake analysis in WT or Glut1 (Slc2a1) and Glut3 (Slc2a3) double knock-down (DKD) EBs. The values are normalized to the protein concentration (n = 3 biological independent samples). d EBs at day 2 were cultured in medium containing 125 mM, 25 mM, or 1 mM glucose. Expression of the indicated genes was analyzed by qPCR at EBs day 3 (n = 4 biological independent samples). e Glucose uptake analysis in WT and NEMEP KO EBs. The values are normalized to the protein concentration (n = 3 independent samples). f–j WT and Nemep KO EBs at day 3 were supplied with 25 mM glucose, 2 µM oligomycin, and 50 mM 2-DG at the indicated times. ECAR was examined using Seahorse XFe96 analyzer (f). Normalized to the protein concentration (n = 8 biological independent samples). Relative non-glycolytic acidification (g), glycolysis levels (h), glycolytic capacity (I), and glycolytic reverse (j) were normalized to the protein concentration (at least 6 biological independent samples per genotype). k Heatmap displaying glycolysis, TCA cycle, and pentpentose phosphate pathway metabolites in WT and Nemep KO EBs at day 3; these data are from a targeted metabolomics profiling analysis (n = 3 biological independent samples). a–j: Data are the mean ± S.E.M. P values were determined by unpaired two-tailed t-tests (d), one-way ANOVA (c, e–j) with Dunnett’s corrections or two-way ANOVA (a, b) with Dunnett’s corrections, and data are representative of three independent experiments with similar results. Source data are provided as a Source Data file.

