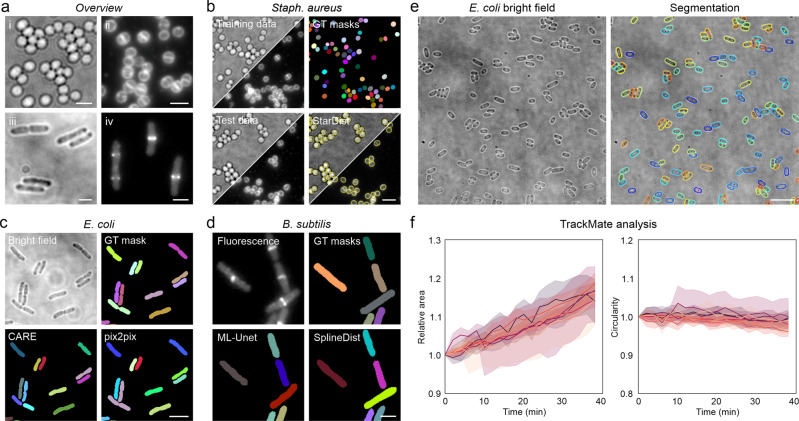
Fig. 2. Segmentation of bacterial images using open-source deep learning approaches.
a Overview of the datasets used for image segmentation. Shown are representative regions of interest for (i) S. aureus bright field and (ii) fluorescence images (Nile Red membrane stain), (iii) E. coli bright field images and (iv) fluorescence images of B. subtilis expressing FtsZ-GFP47. b Segmentation of S. aureus bright field and membrane-stain fluorescence images using StarDist9. Bright field and fluorescence images were acquired in the same measurements and thus share the same annotations. Yellow dashed lines indicate the cell outlines detected in the test images shown. c Segmentation of E. coli bright field images using the U-Net type network CARE14 and GAN-type network pix2pix18. A representative region of a training image pair (bright field and GT mask) is shown. d Segmentation of fluorescence images of B. subtilis expressing FtsZ-GFP using U-Net and SplineDist42. GT = ground truth. e Segmentation and tracking of E. coli cells during recovery from stationary phase. Cells were segmented using StarDist and tracked with TrackMate45,46. f Plots show the mean (line) and standard deviation (shaded areas) for all cells in seven different regions of interest (colour-coded). Morphological features were normalised to the first value for each track. Scale bars are 2 µm (a, d), 3 µm (b, c) and 10 µm (e).

