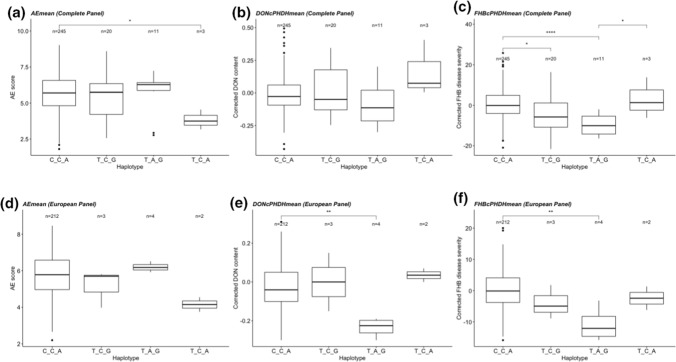
Fig. 4.
Boxplot showing the haplotype effect of QTL on chromosome 7A based on the a mean AE, b mean corrected DON content, c mean corrected FHB disease severity of complete panel, and d mean AE, e mean corrected DON content, f mean corrected FHB disease severity of European panel. Wilcoxon method is used for pair-wise comparisons (***P < 0.0001, **P < 0.001, *P < 0.05, ns > 0.05). Nonsignificant comparisons are not shown in this figure

