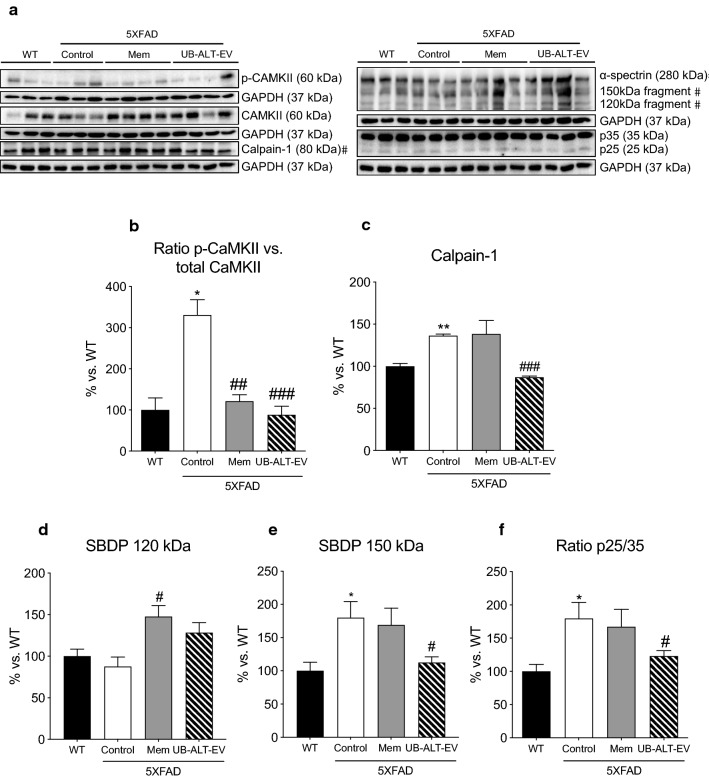
Fig. 3.
Representative western blot (a) and quantifications for ratio p-CAMKII vs. total CAMKII (b), Calpain-1 (c), SBDP 120 kDa (d), SBDP 150 kDa (e), and ratio p25/35 (f). Values in bar graphs are adjusted to 100% for protein levels of the wild type (WT). Values are the mean ± Standard error of the mean (SEM) (n = 3 for WT and Control groups and n = 4 for Mem and UB-ALT-EV groups). For WT vs. 5XFAD control groups, data were analyzed using a two-tailed Student’s t test, and for 5XFAD groups, a standard one-way ANOVA followed by Tukey post hoc analysis was performed. *p < 0.05; **p < 0.01; for WT vs. Control. #p < 0.05; ##p < 0.01; ###p < 0.001 for Mem or UB-ALT-EV vs. Control

