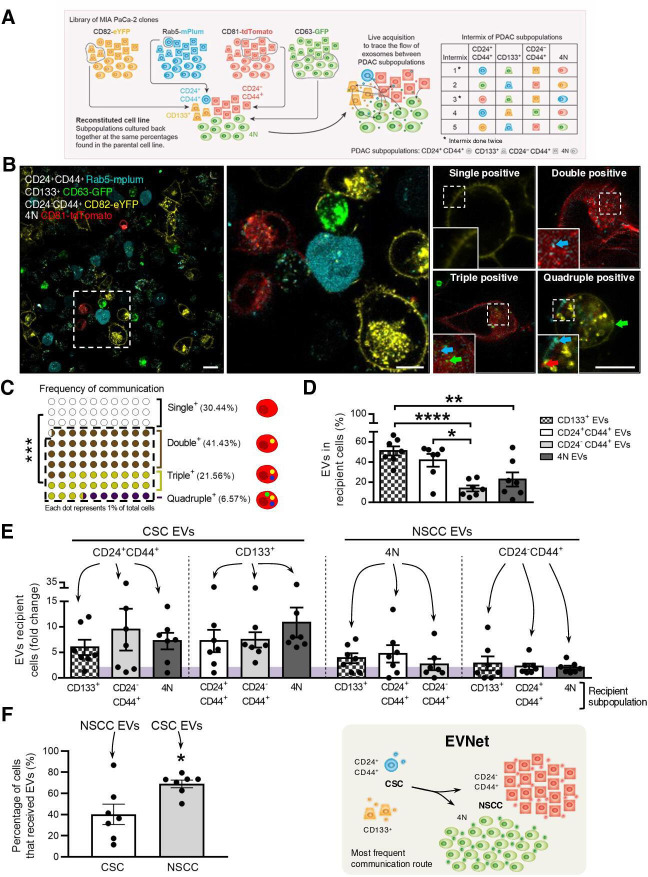
Figure 1.
The most frequent communication route in the PDAC EVNet occurs from CSC to NSCC. (A) Schematics of the methodological approach: MIA PaCa-2 clones expressing different fluorescently labelled markers are cultured at the percentages found in the parental cell line and are analysed through flow cytometry in order to trace the flow of EVs among subpopulations. A total of seven intermix of colour-coded subpopulations was analysed, corresponding to five distinct intermixes. Subpopulations: CD24+CD44+ refers to CD24+CD44+CD133−EpCAM−; CD133 +refers to CD133+CD24−CD44−EpCAM−; CD24-CD44+ refers to CD24−CD44+CD133−EpCAM−; 4N refers to CD24−CD44−CD133−EpCAM−. (B) Representative confocal microscopy live images of 72-hour culture MIA PaCa-2 colour-coded subpopulations (CD133+ CD63-GFP, CD24+44+ Rab5-mPlum, CD24-CD44+ CD82-eYFP and 4N CD81-tdTomato). Right panel: representative images of a cell where EVs uptake was not detected (single positive), a cell that received EVs from one different subpopulation (double positive), a cell that received from two other subpopulations (triple positive) or from all four subpopulations (quadruple positive). Scale bars from left to right: 20, 10 and 10 µm. (C) Dot plot representing the percentage of single-positive, double-positive, triple-positive and quadruple-positive cells found in the cocultures (n=7, Mann-Whitney test ***p<0.001). (D) Quantification of the percentage of cells that received EVs from CD133+, CD24+CD44+, CD24−44+ and 4N subpopulations (n=7, one-way analysis of variance (ANOVA) *p<0.05, **p<0.01, ****p<0.0001). (E) Quantification of cells of different subpopulations that receive EVs from CSC or NSCC (highlighted on top). The fold change was calculated against the minimum percentage of communication found in each coculture (n=7). (F) Quantification of the percentage of cells that received EVs (left) and schematic representation of the most frequent communication route in the EVNet, from CSC to NSCC (right, comparison of CSC positive for NSCC EVs and NSCC positive for CSC EVs; n=7, Mann-Whitney test, *p=0.0379). Data are mean±SEM. CSC, cancer stem cell; EVs, extracellular vesicles; EVNet, Extracellular Vesicles from Pancreatic Cancer Stem Cells Lead an Intratumor Communication Network; NSCC, non-stem cancer cells; PDAC, pancreatic ductal adenocarcinoma.

