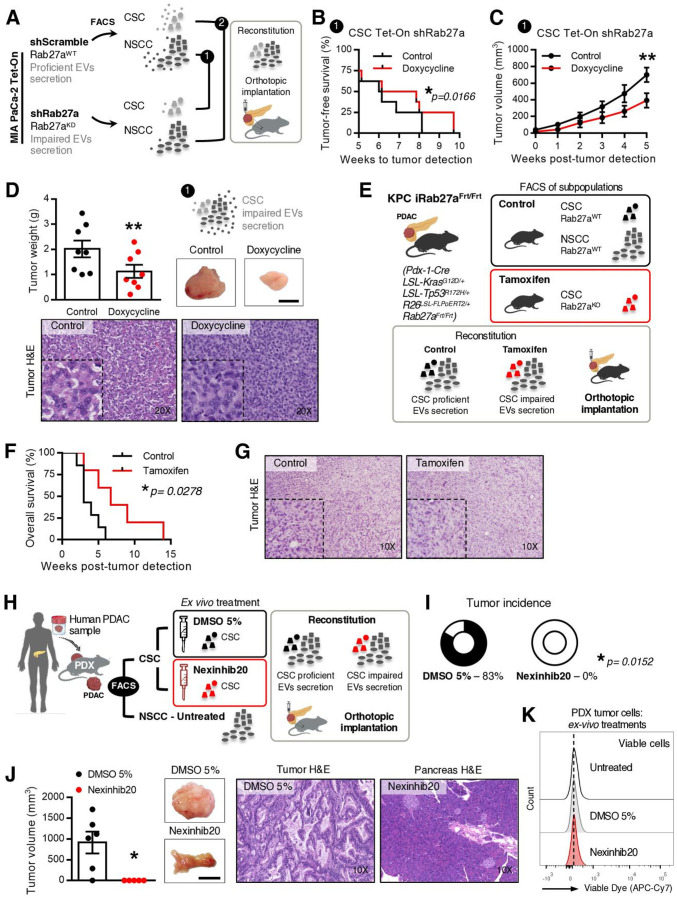
Figure 4.
Impairment of communication by EVs originated in CSC is sufficient to hamper tumour growth in PDAC orthotopic, GEMM and PDX models. (A) Experimental plan to impair specific routes of communication mediated by EVs in a PDAC orthotopic model using the MIA PaCa-2 Tet-On system. (B) Kaplan-Meier curve representing weeks to tumour detection of mice with CSC proficient (CSC Tet-On shRab27a control n=8) and CSC impaired EV secretion (CSC Tet-On shRab27a doxycycline n=8; paired t-test; *p<0.05). (C) Tumour growth curve measured by ultrasound of mice with CSC proficient (CSC Tet-On shRab27a control n=8) and impaired EV secretion (CSC Tet-On shRab27a doxycycline n=8; two-way analysis of variance; **p<0.01). (D) Tumour weight of groups described in (B, C). On the right, representative photos of tumours at time of euthanasia and respective H&Es (bottom, Wilcoxon test; **p<0.01). Scale bar: 10 mm. (E) Experimental layout to impair communication by CSC using a PDAC GEMM. Of note, as shown before (online supplemental figure 1D), the subpopulation positive for EpCAM (EpCAM+) was identified in the KPC and included in the NSCC. (F) Kaplan-Meier curve of the overall survival of mice with proficient CSC EV secretion (CSC were sorted from tumours of non-treated KPC iRab27aFrt/Frt mice, control n=7) and CSC with impaired EV secretion (CSC were sorted from tamoxifen-treated KPC iRab27aFrt/Frt mice, tamoxifen n=5, log-rank Mantel-Cox test; *p=0.0278). (G) Representative H&E staining of tumours in control and tamoxifen groups. (H) Experimental layout to impair communication by CSC EVs in a PDX model. (I) Tumour incidence in CSC proficient in EV secretion (CSC sorted from PDX tumour, treated ex vivo with DMSO 5% and injected with their NSCC counterparts), and CSC impaired EVs secretion (CSC were sorted from PDX tumour and treated ex vivo with Nexinhib20 (1 µM) before injection with their NSCC counterparts). DMSO 5% n=6, Nexinhib20 n=5 (Fisher’s exact test *p=0.0152). (J) Tumour volume and representative photos of tumours at time of euthanasia and respective H&ES of groups of mice described in (H, I). DMSO 5% n=6, Nexinhib20 n=5 (permutation test, *p=0.0123). Scale bar: 10 mm. (K) Representative flow cytometry analysis of viable cancer cells derived from PDX cells non-treated, DMSO 5% treated or treated with Nexinhib20 ex-vivo. Data are mean±SEM. CSC, cancer stem cell; EVs, extracellular vesicles; GEMM, genetically engineered mouse model; NSCC, non-stem cancer cell; PDAC, pancreatic ductal adenocarcinoma; PDX, patient-derived xenograft.

