Figure 7.
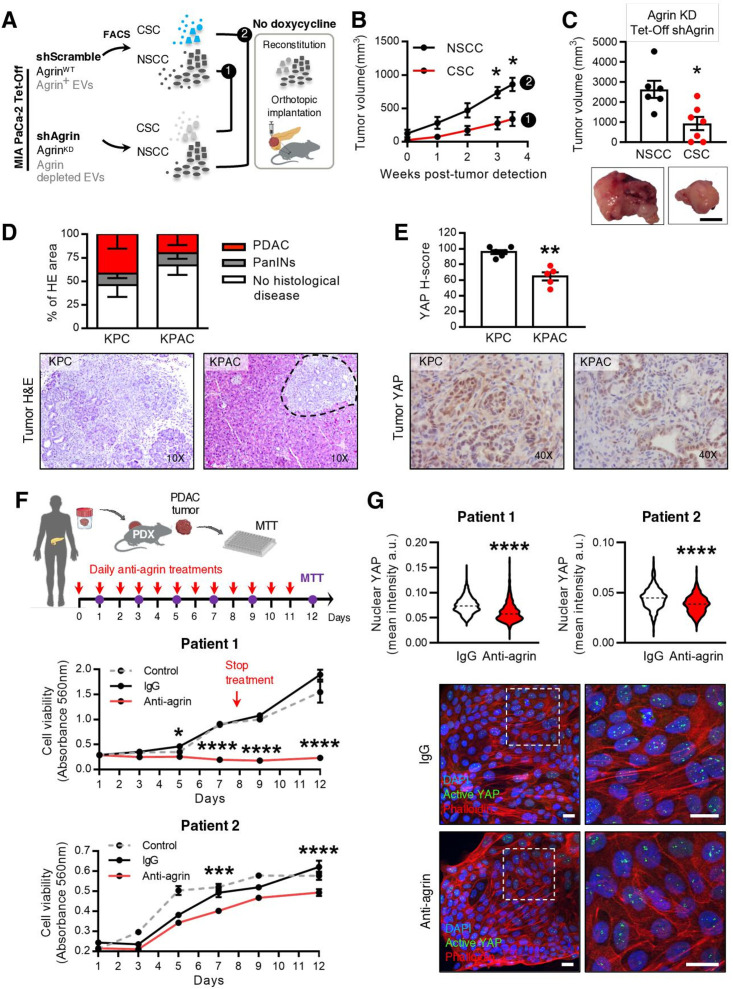
Agrin in CSC promotes PDAC progression and blocking agrin in PDX cells impairs their proliferation. (A) Experimental layout: to impair agrin expression in specific cancer cell subpopulations, CSC and NSCC were sorted from the MIA PaCa-2 Tet-Off shAgrin and shScramble clones, respectively, and then orthotopically implanted into the pancreas of Rag2−/−Il2rg−/− mice. (B) Tumour growth curve measured by ultrasound of untreated (agrin kD) tumours CSC from MIA PaCa-2 Tet-Off shAgrin plus NSCC from MIA PaCa-2 Tet-Off shScramble (injected at the same percentages found in the cells of origin, n=7) and NSCC from MIA PaCa-2 Tet-Off shAgrin with CSC from MIA PaCa-2 Tet-Off shScramble (injected at the same percentages found in the cells of origin, n=6, two-way ANOVA; *p<0.05). (C) Quantification of tumour volume at euthanasia and representative photos of pancreas tumours (Mann-Whitney test, *p<0.05). Scale bar: 10 mm. (D) Histological evaluation of the percentage of the pancreas that showed no histological disease, PanINs and PDAC area in KPC and KPAC mice euthanised at 14 weeks of age and corresponding H&E pictures (KPC n=6, KPAC n=5). (E) YAP H-score and representative immunohistochemistry photos in KPC and KPAC (KPC n=6, KPAC n=5) (Mann-Whitney test,**p<0.01). (F) Schematic representation of PDX ex vivo treatment with human antiagrin neutralising antibody. Cell viability was measured by absorbance at 560 nm (MTT assay). PDX cells were treated ex vivo either from day 0 to day 8, every day (patient 1), or from day 0 to day 11, every day (patient 2), with antiagrin blocking antibody (Mab5204 10 μg/mL), IgG (10 μg/mL) or untreated (control). Comparison was performed with PDX ex vivo treated with IgG (two-way ANOVA; *p<0.05, ***p<0.001, ****p<0.0001). Arrow indicates timepoint that treatment was stopped in patient 1. (G) Quantification of YAP nuclear levels in PDX cells treated ex vivo from day 0 until day 5, every day, with antiagrin blocking antibody (Mab5204 10 μg/mL) or IgG (10 μg/mL) (top) (mean intensity per cell, n=1, six images per group, unpaired t-test; ****p<0.0001). Data are min to max. Dashed lines in violin plots represent median values. Representative confocal microscopy photos of treated PDX cells. Scale bar: 20 µm. Active YAP (green), phalloidin (red) and nuclei (blue) (bottom). Data are mean±SEM. ANOVA, analysis of variance; KD, knockdown; KPAC, agrin knockout KPC; CSC, cancer stem cells; EVs, extracellular vesicles; FACS, fluorescence activated cell sorting; MTT, methylthiazolyldiphenyl–tetrazolium bromide; NSCC, non-stem cancer cell; PDAC, pancreatic ductal adenocarcinoma; PDX, patient-derived xenograft.

