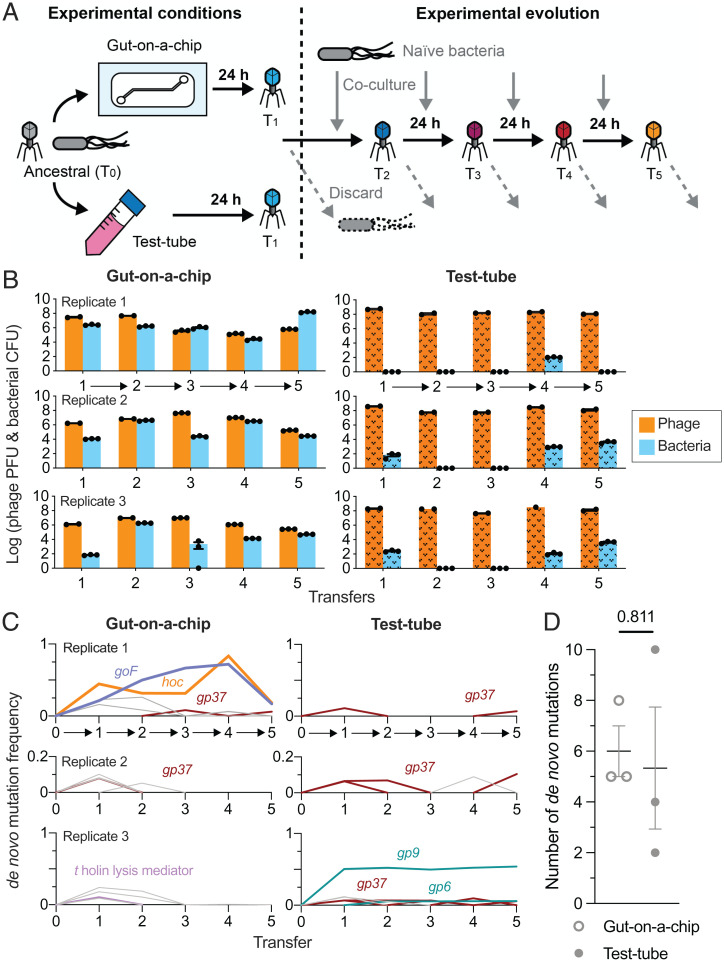
Fig. 2.
Phages evolve in response to the mammalian mucus layer in the gut-on-a-chip. (A) Ancestral (zeroth transfer; T0) T4 phage and E. coli bacterial hosts were inoculated into three gut-on-a-chip and test-tube setups, respectively. The cocultures were incubated for 24 h with phages subsequently harvested for the first transfer (T1). Phages from T1 were transferred to either fresh chips or test tubes seeded with naïve E. coli B hosts and the process was repeated until the fifth transfer (T5). (B) Density of phages and bacteria from the mucus layer collected from the gut-on-a-chip (plain colored bars) and test-tube (textured colored bars) replicates at the end of each 24-h passage. The arrows along the x axis represent the experimental evolution phage transfer in-line with A. (C) Frequency of de novo mutations emerging from the phage population over five transfers from the gut-on-a-chip and test-tube setups. Colored lines represent the mutations: D246N hoc mutation in orange, Δ21bp goF mutation in purple, gp37 (distal subunit phage long-tail fiber) in brown, t holin lysis mediator in pink, and gp6 and gp9 (phage baseplate subunits) in teal. Gray lines represent other transient and low-frequency de novo mutations (Dataset S3). The arrows along the x axis represent the experimental evolution phage transfer in-line with A. (D) Average number of de novo mutations from phage populations evolved in gut-on-a-chip and test-tube conditions. Data points in B were plotted as a bar chart with error bars representing mean ± SEM of technical replicates (n = 2 or 3, except test-tube replicate 3, transfer 4 for phage, where n = 1). Data points in D were mutational counts from independent experimental replicates as specified in Dataset S3, with lines and error bars plotted as mean ± SEM across three experimental replicates (n = 3). The P value in D was derived from an unpaired two-tailed t test from three experimental replicates (n = 3).

