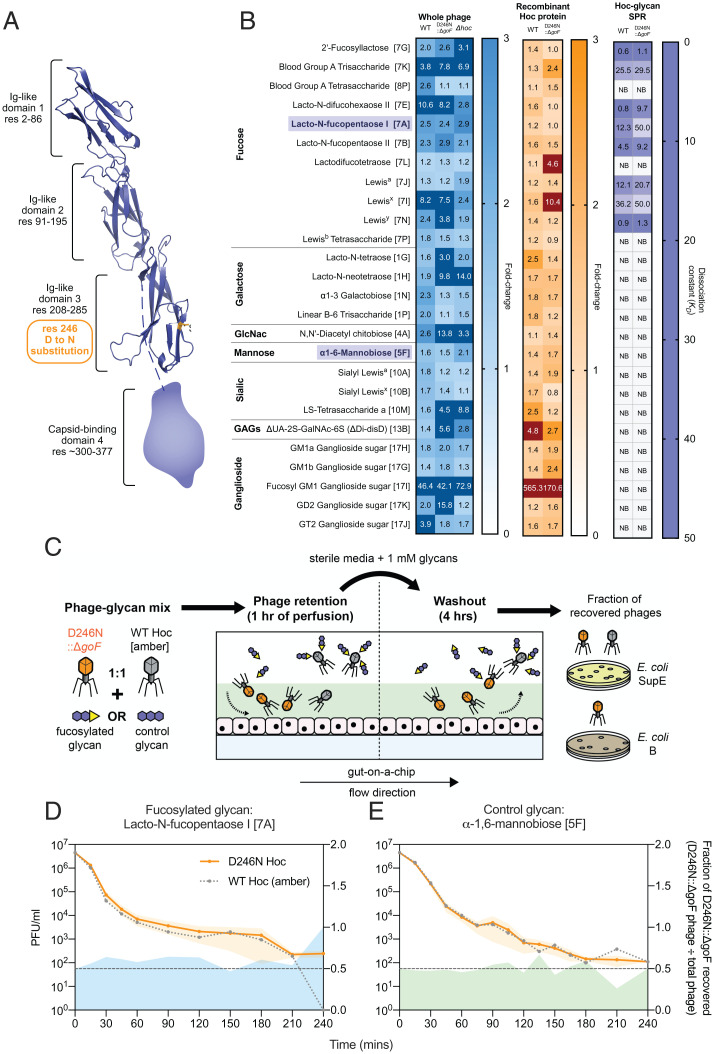
Fig. 4.
Phages evolved in the mammalian mucus layer exhibit altered the mucus-adherence phenotype. (A) T4 Hoc protein structure model demonstrating the position of the D246N mutation within the third Ig-like domain, highlighted in orange. The capsid-binding fourth domain was not modeled due to the lack of structural homologs in the Protein Data Bank. (B) Normalized fold-change fluorescence intensities of the 26 top glycan array hits (glycan ID corresponding to Dataset S5 as indicated in square brackets) of labeled, ultrapurified whole phages: wild-type (WT), D246N::ΔgoF phage, and Δhoc: blue heatmap; recombinantly expressed Hoc proteins: wild-type and D246N: orange heatmap; followed by SPR assessing glycan-to-Hoc protein binding strength: purple heatmap. Numerical values in glycan array heatmaps represent fold-change magnitude normalized against background fluorescence where dark-color panels indicate high fold-change values that were out-of-bounds from the heatmap gradient. Numerical values in the SPR heatmap represent KD values where higher KD values indicate lower binding affinity. “NB” in the SPR heatmap indicates no binding event. Bolded and purple-highlighted glycans 7A (lacto-N-fucopentaose I) and 5F (α-1,6-mannobiose) represent the glycans selected for phage retention and washout experiments in D and E. (C) Experimental setup for phage retention and washout from the gut-on-a-chip, where equal proportions of wild-type Hoc (with am43−/44− mutation) and D246N::ΔgoF phages in 1 mM glycan solutions were perfused in the gut-on-a-chip for 1 h during the retention phase. Subsequently, sterile media supplemented with 1 mM glycan were perfused for 4 h to initiate phage washout from the mucus layer. Washouts were collected at set time intervals and phages were quantified via selective plating on E. coli SupE (permissive for both wild-type Hoc [am43−/44−] and D246N::ΔgoF phage) and E. coli B (only permissive for D246N::ΔgoF phage). (D) Washout of wild-type Hoc and D246N::ΔgoF phages from the gut-on-a-chip under flow with 1 mM fucosylated glycan 7A (lacto-N-fucopentaose I) or (E) control glycan 5F (α-1,6-mannobiose) over 4 h. Lines with shaded regions in D and E were plotted along the left y axis as mean ± SEM of three experimental replicates (n = 3) per time point. The plotted gray dotted line with data points represents the expected number of wild-type Hoc phages recovered by subtracting D246N::ΔgoF phages from the total phage number recovered. Shaded regions extending along the x axis and right y axis represent the D246N::ΔgoF phage fraction over the total phage number recovered (D246N::ΔgoF phage ÷ total phage recovered) from the gut-on-a-chip across time. The black dotted line along 0.5 of the right y axis represents the fraction expected if D246N Hoc and wild-type Hoc phages were recovered at equal proportions.

