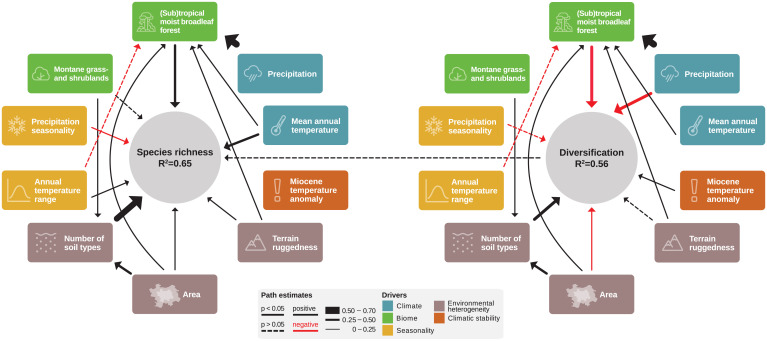
Fig. 2.
The structural equation model depicts direct and indirect drivers of species richness (SR) and diversification rates (MRD). The width of arrows is proportional to relative effect size (SI Appendix, Table S2). Black arrows represent positive effects, and red arrows represent negative effects; nonsignificant effects are shown as dashed lines. Drivers are color coded for the hypotheses they address.

