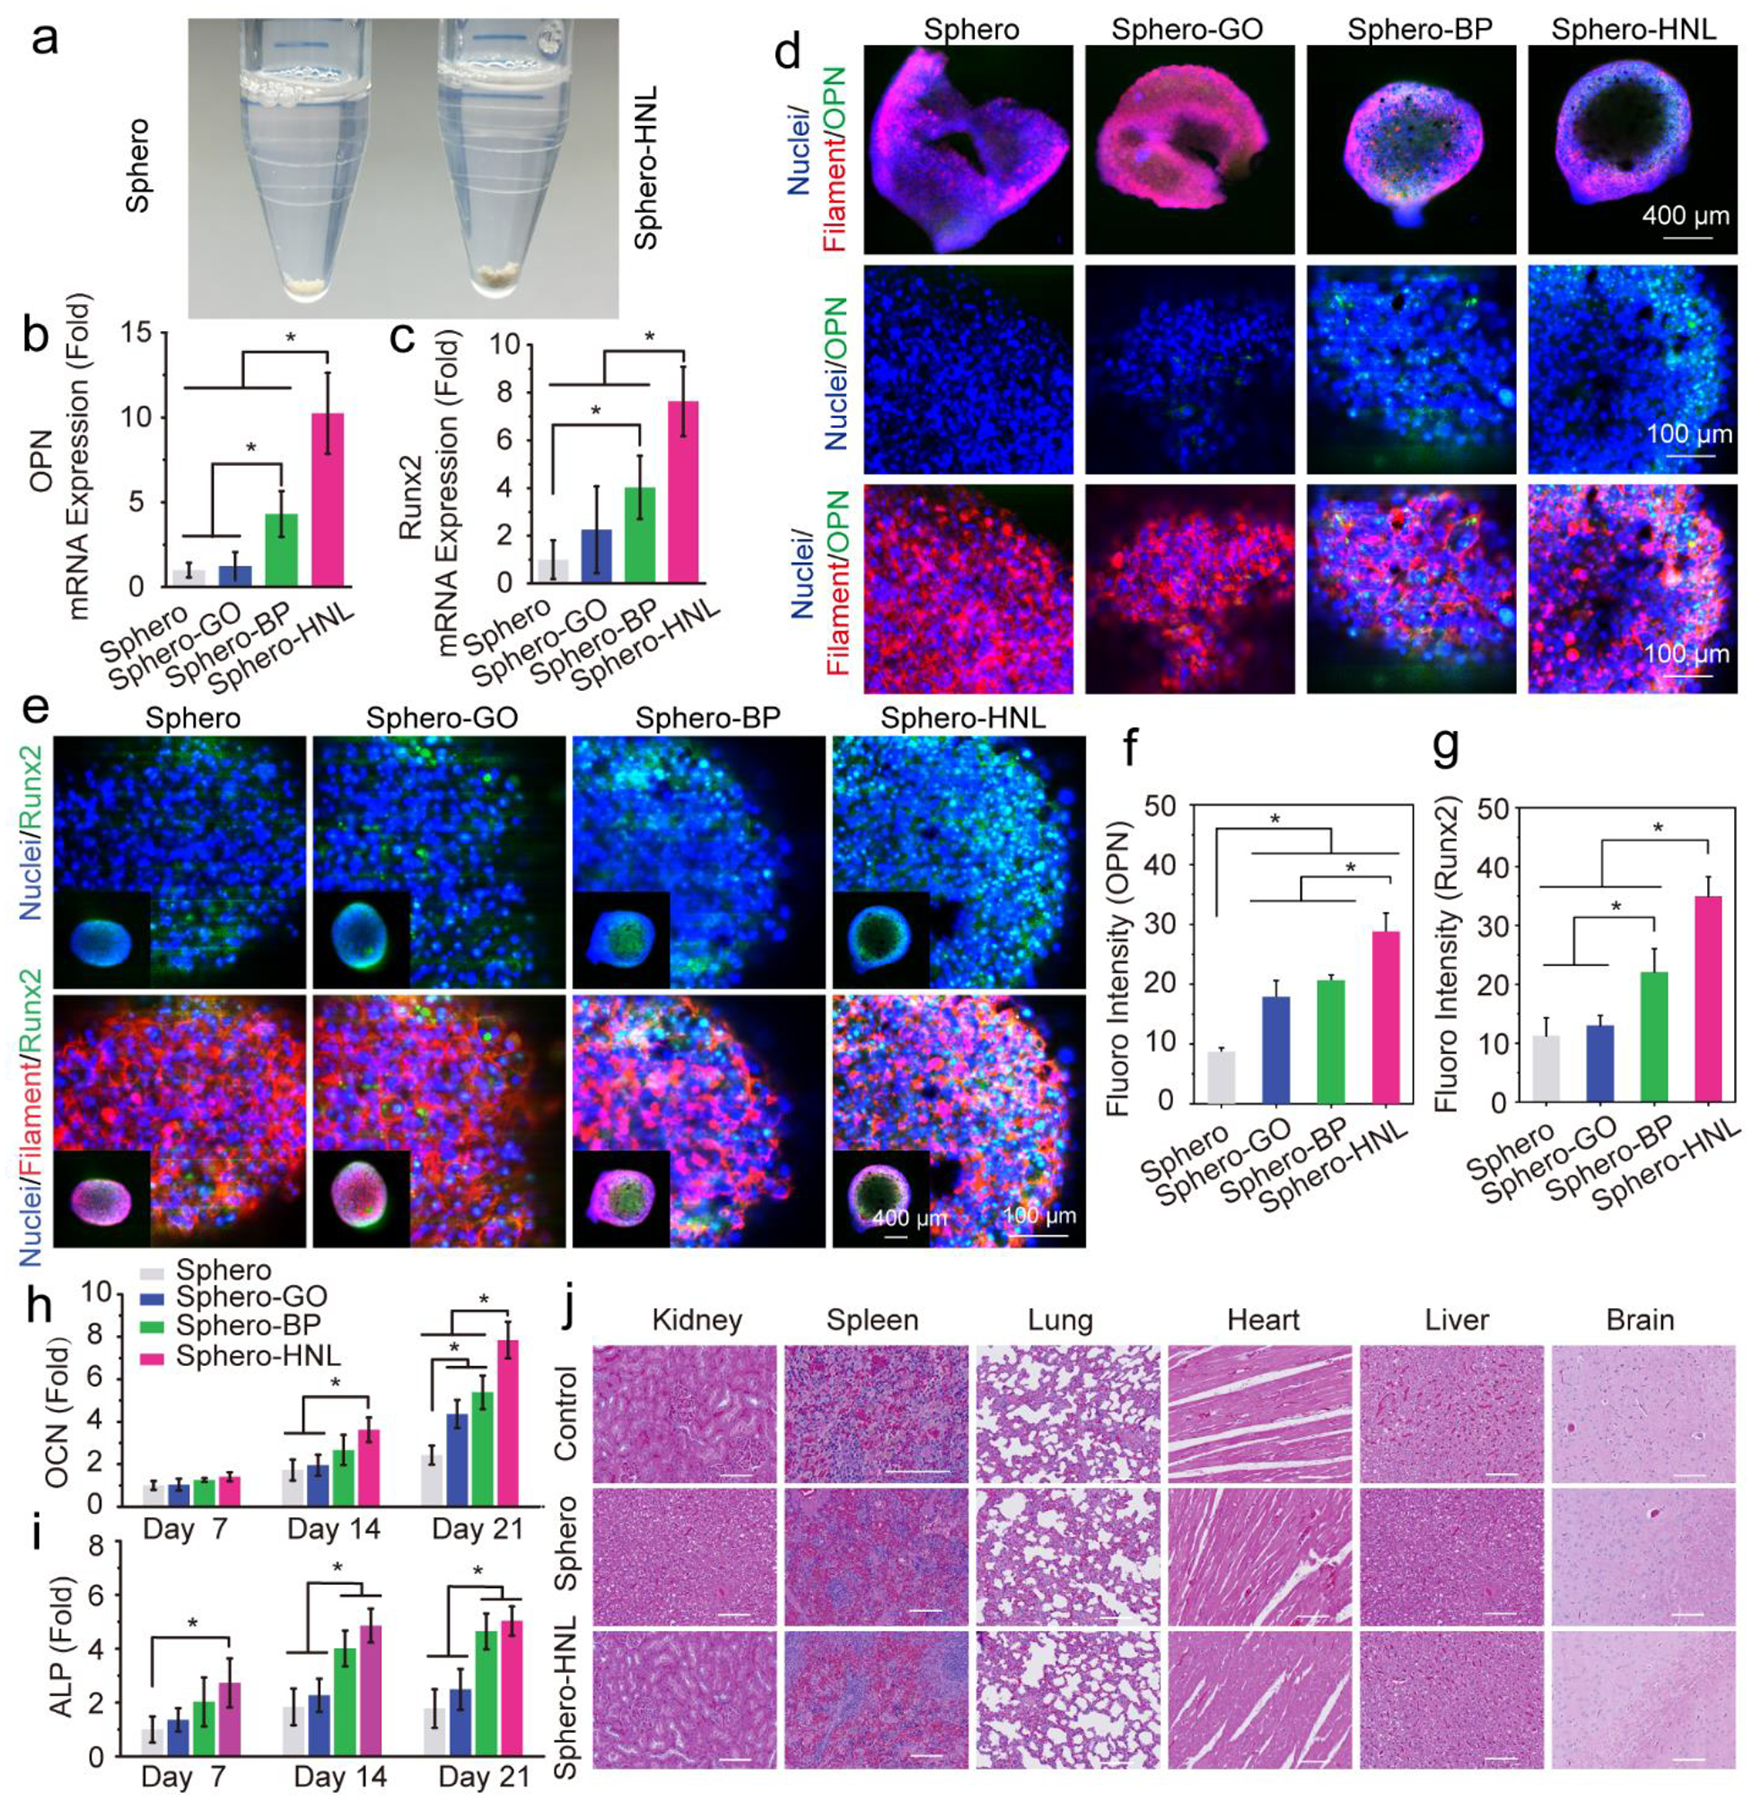
Fig. 4.

Osteogenesis of stem cell spheroids. a) Photographs of the Sphero and Sphero-GO@BP. The mRNA expressions of osteogenic markers b) OPN and c) Runx2 in stem cell spheroids after 14 days of culture. d) Immunofluorescent imaging of osteogenic OPN protein (green), F-actin (red), and nuclei (blue) in stem cell spheroids. e) Immunofluorescent imaging of osteogenic Runx2 protein (green), F-actin (red), and nuclei (blue) in stem cell spheroids. Quantified fluorescence intensity for f) OPN and g) Runx2 markers in spheroids. h) Relative OCN content and i) ALP activity of stem cell spheroids. j) Histological staining of the major organs of rats after 8 weeks of implantation with spheroids (scale bar: 200 μm). (*: p < 0.05).
