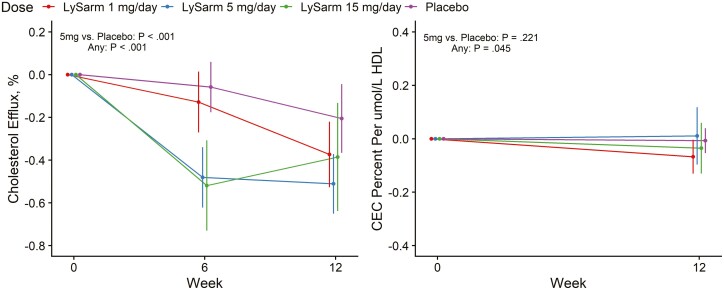
Figure 1.
Changes from baseline to week 12 in serum cholesterol efflux capacity and cholesterol efflux capacity normalized to high-density lipoprotein particle number by treatment arm. Point estimates, 95% CIs, and P values extracted from a mixed-model framework. P values are for overall dose effect and comparison between the 5 mg daily dose group and placebo groups.

