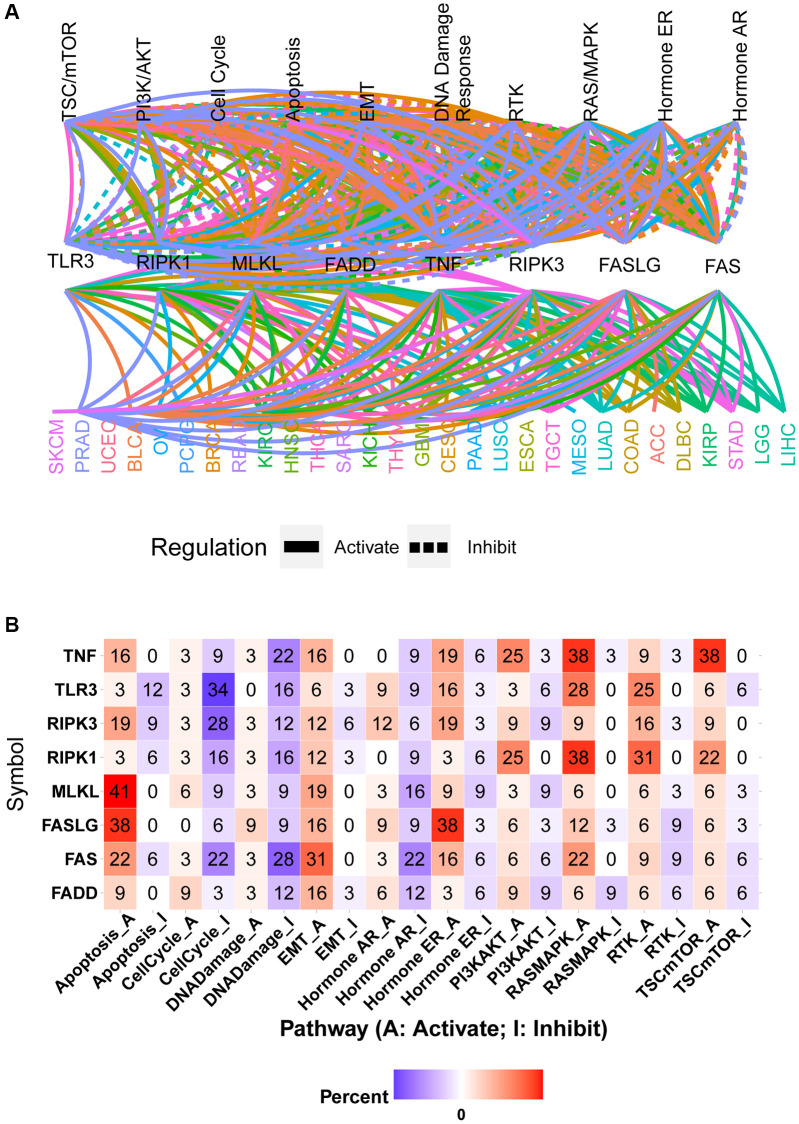
Figure 6.
Pathway activity analysis of necroptosis-related regulators. (A) Gene-pathway network showed the regulatory relationship between necroptosis-related regulators and cancer pathways in pan-cancer. Different colors represent different cancer types. (B) The heatmap showed the percentage of cancer types in which the specific necroptosis-related regulator has an effect (FDR ≤ 0.05) on the specific pathway in pan-cancer.

