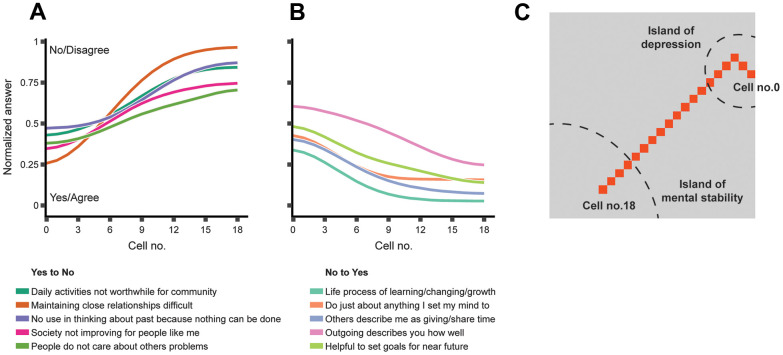
Figure 3.
The features that change the most along the path between the respondents mapped to the “island of depression” and those mapped to the “island of mental stability.” (A) Top-five attitudes that are generally not shared by mentally stable people but are prevalent among depressed people; (B) Top-five attitudes that are prevalent in mentally stable people but generally not shared by depressed people; (C) The shortest path connecting the SOM cell with the highest prevalence of depressed people (cell-0) to the cell with the highest prevalence of non-depressed people (cell-18). The curves in Panel A and Panel B represent the feature vectors stored in the SOM cells on the path from cell-0 to cell-18. The path displayed in Panel C is also marked in Figure 1D.

